You are using an out of date browser. It may not display this or other websites correctly.
You should upgrade or use an alternative browser.
You should upgrade or use an alternative browser.
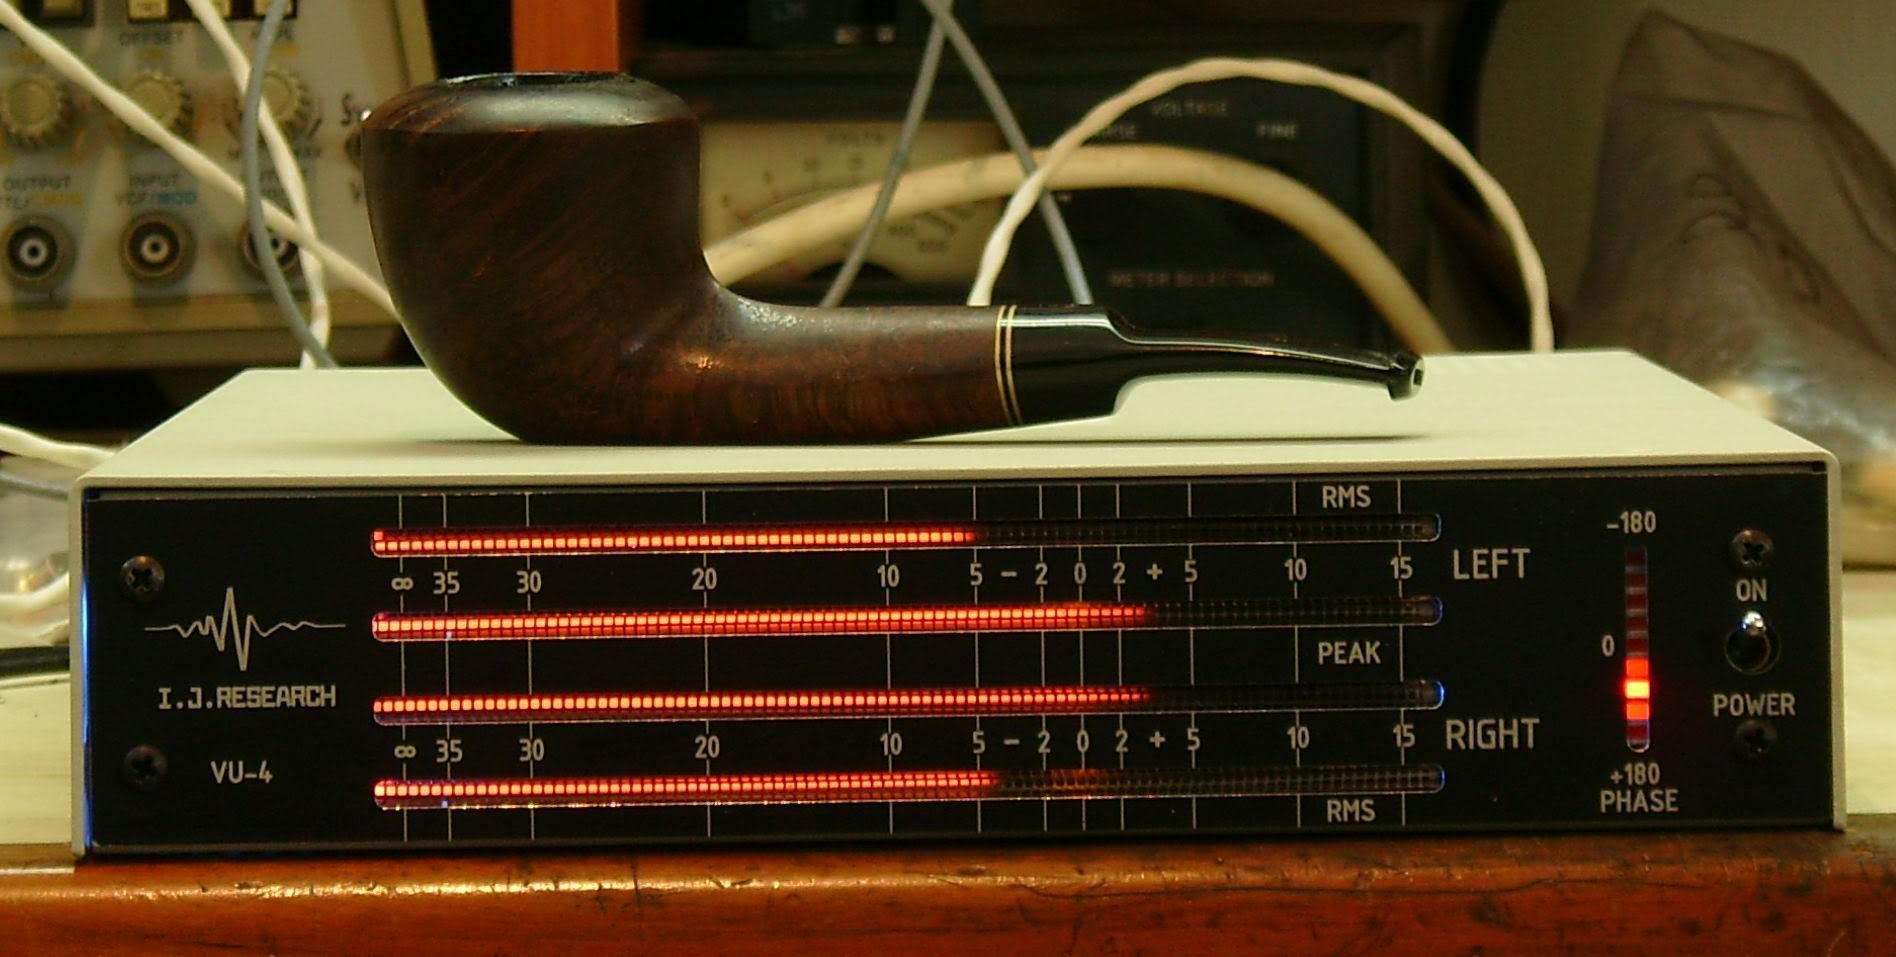
Absolutely cool plasma VU-meter: IT WORKS!!!! /Pictures/
- Thread starter Igor
- Start date


Help Support GroupDIY Audio Forum:
This site may earn a commission from merchant affiliate
links, including eBay, Amazon, and others.
thats very very very cool 
I want one :sad:
I want one :sad:
SSLtech
Well-known member
No shizzle!!!
-Hey, I have a couple of spare plasma tubes here that are too wide to fit into an SSL (they custom-shaved the width ofthe glass to make it fit)
-Can I buy the PCB's from you to make one???
VERY well done, BTW. -Whenever I see "Igor" at the head of a new thread, I always say "oh-oh... this is going to be impressive!" and make sure I'm sitting down before clicking. -It still doesn't usually stop my chin hitting my chest as my jaw drops open, though!
-You owe me a keyboard. I was drinking coffee when I clicked on it, and the coffee dropped out of my hand, I was so stunned!
Keith
Svart
Well-known member
Igor is the man. And the man loves his pipe.
What kind of tobacco is your favorite?
What kind of tobacco is your favorite?
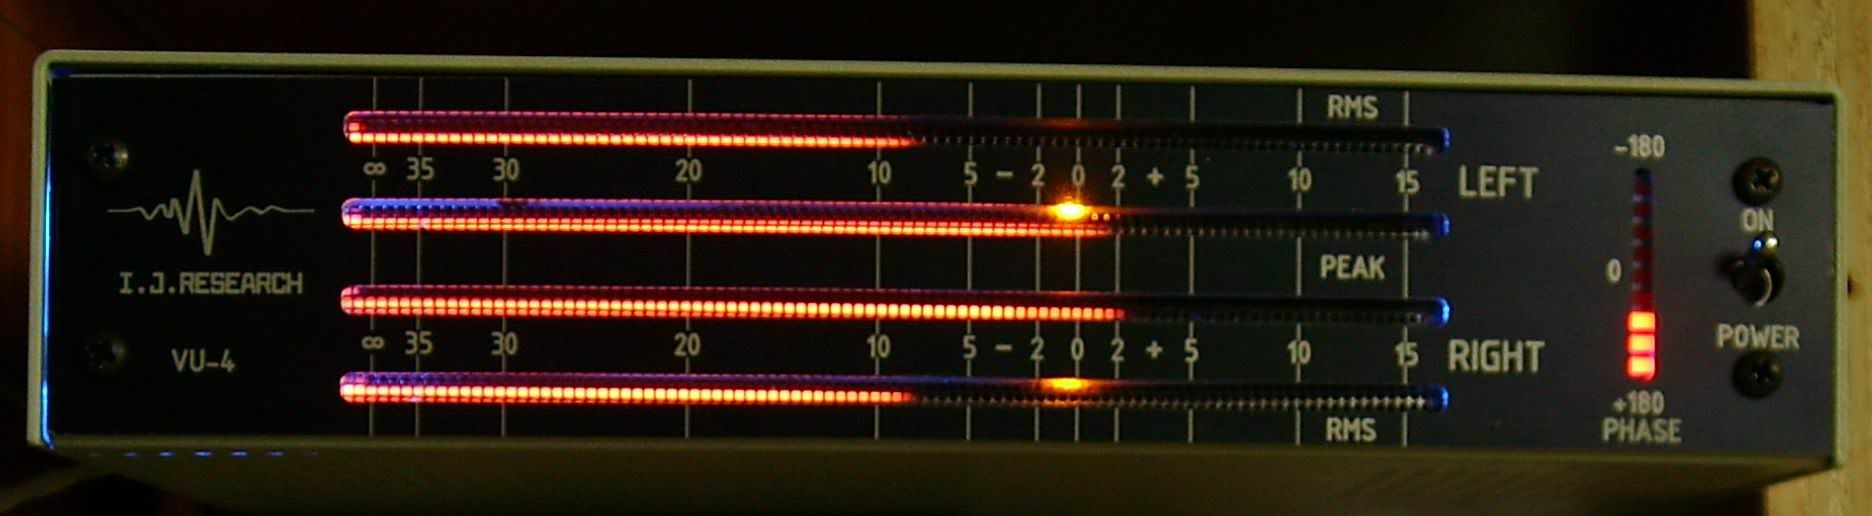
Sweet. I like the log scale. That makes it possible to visually compute crest factor (peak to average) from visual inspection. Can I assume a sine wave input shows up as a 3 dB offset between PK and RMS?
That reminds me of a prototype meter I did back in early '80s for a console series that never made it into production. I did build one working unit.
I used a 100 segment vacuum fluorescent and scaled it for 1 dB per segment. Once you start displaying peak, I thought it useful to show all the way up to +25dBu or whatever was clipping in my console. Average (RMS) levels much below -20 or -30 are nice to see but IMO not as important as immediately around 0VU. It is nice to have more resolution around 0VU but be warned customers will expect strict agreement from meter to meter.
I combined the PK and RMS together onto one display http://www.patentgenius.com/patent/4166245.html . You will notice that your peak display will never indicate lower than your RMS unless it has a faster release time. I took advantage of that relationship and made the peak a single dot floating above the RMS connected string of illuminated segments.
I actually did a true RMS approximation for that one prototype meter but used simple average for the sundry variant meters that eventually found their way into production.
The ability to see peak and ave (RMS) simultaneously is IMO more visually interesting in the recording studio enviroment looking at individual instruments, than on the two mix, since mixing everything together reduces the crest factor making the difference between PK and ave (RMS) smaller. However looking at the final mix you can see how dynamic or how compressed the mix is from that difference.
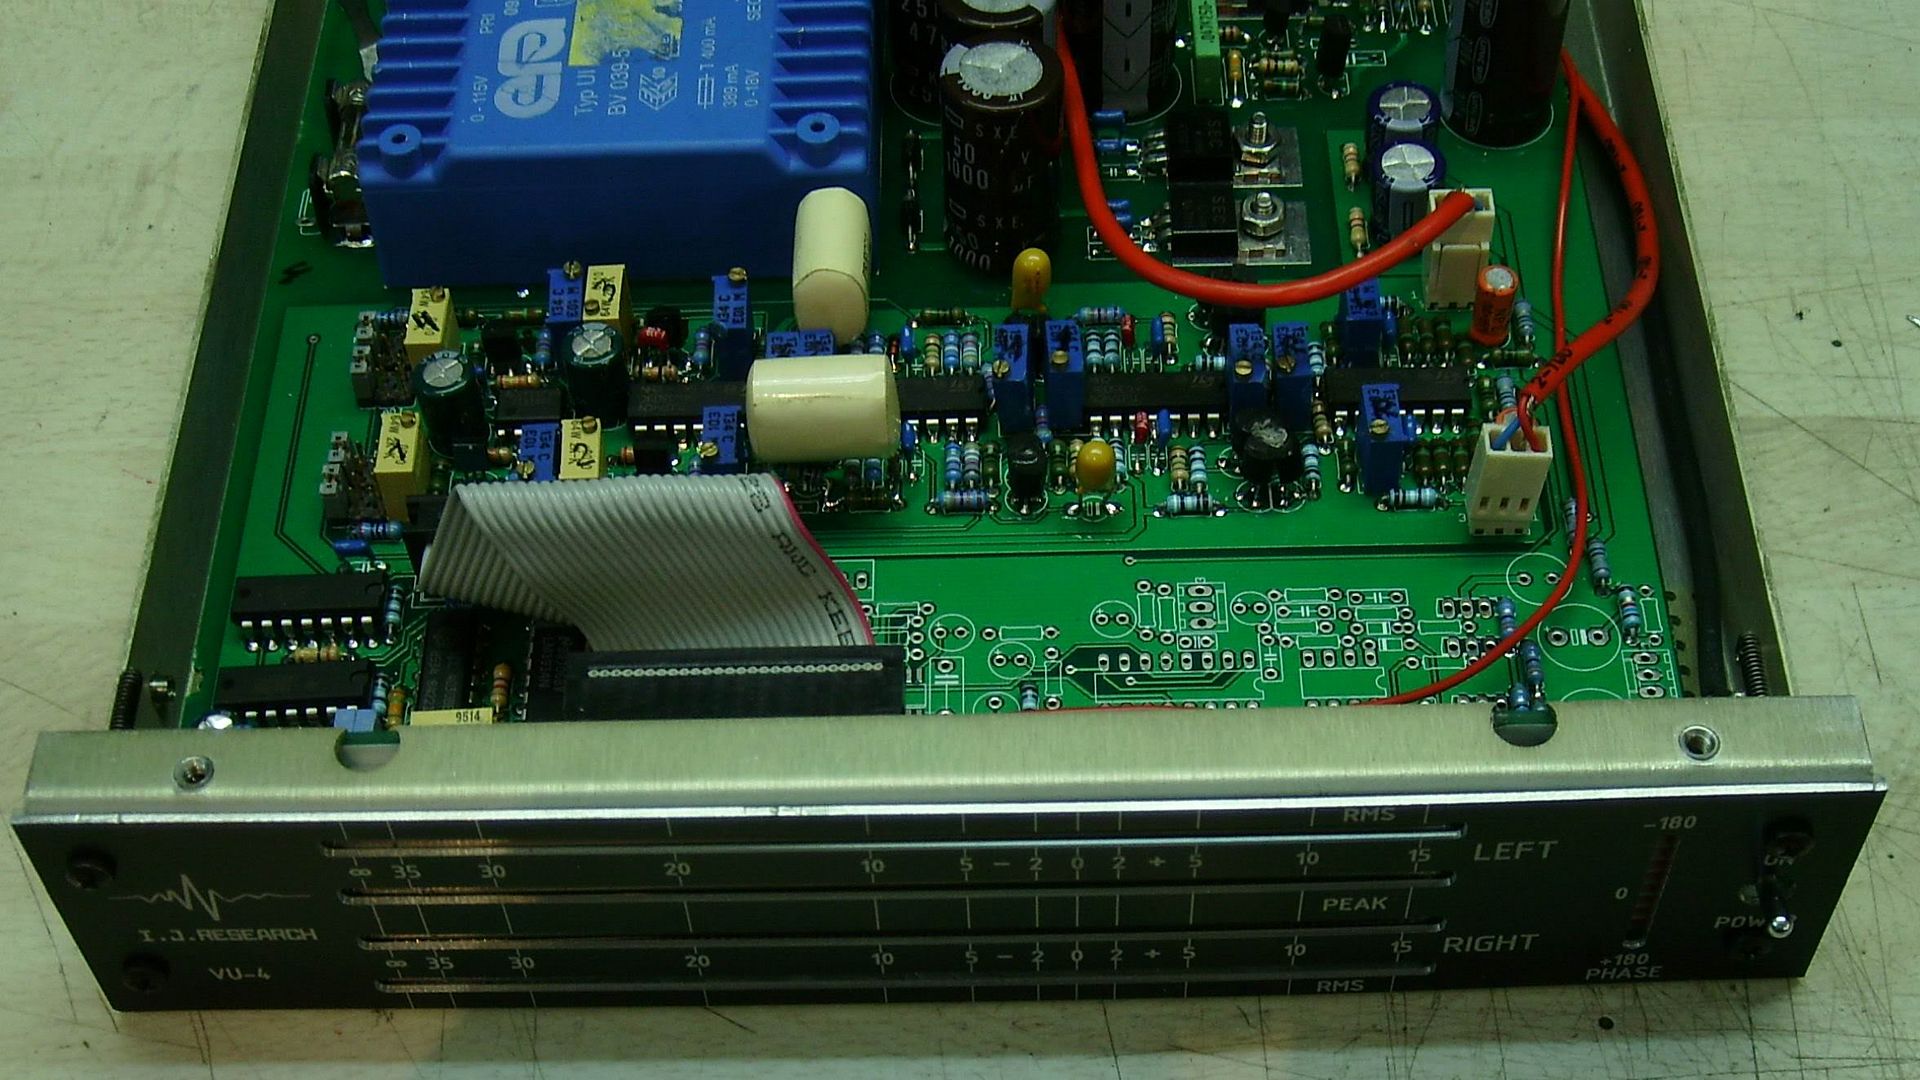
Nice job, I certainly can appreciate what went into that design. I notice some transistors glued together. In my RMS conversion circuit I used a transistor array (CA3046?) so the devices were well bonded thermally. Inexpensive transistor arrays are harder to come by these days.
JR
PS: That patent is long since expired and public domain, not that that stopped others when the patent was in force.
That reminds me of a prototype meter I did back in early '80s for a console series that never made it into production. I did build one working unit.
I used a 100 segment vacuum fluorescent and scaled it for 1 dB per segment. Once you start displaying peak, I thought it useful to show all the way up to +25dBu or whatever was clipping in my console. Average (RMS) levels much below -20 or -30 are nice to see but IMO not as important as immediately around 0VU. It is nice to have more resolution around 0VU but be warned customers will expect strict agreement from meter to meter.
I combined the PK and RMS together onto one display http://www.patentgenius.com/patent/4166245.html . You will notice that your peak display will never indicate lower than your RMS unless it has a faster release time. I took advantage of that relationship and made the peak a single dot floating above the RMS connected string of illuminated segments.
I actually did a true RMS approximation for that one prototype meter but used simple average for the sundry variant meters that eventually found their way into production.
The ability to see peak and ave (RMS) simultaneously is IMO more visually interesting in the recording studio enviroment looking at individual instruments, than on the two mix, since mixing everything together reduces the crest factor making the difference between PK and ave (RMS) smaller. However looking at the final mix you can see how dynamic or how compressed the mix is from that difference.
Nice job, I certainly can appreciate what went into that design. I notice some transistors glued together. In my RMS conversion circuit I used a transistor array (CA3046?) so the devices were well bonded thermally. Inexpensive transistor arrays are harder to come by these days.
JR
PS: That patent is long since expired and public domain, not that that stopped others when the patent was in force.
Ptownkid
Well-known member
Good lord Igor, that's awesome. You need to hang around here more often!!!
mata_haze
Well-known member
Brilliant, amazing..awesome!
With compliments...
Mattia.
With compliments...
Mattia.
G
Guest
Guest
Awesome!
moamps
Well-known member
@Igor
Nice design. I'm a bit puzzled by your correlator scale, though. I'm wondering why you are using a graduation scale from -1 to -1 (cos fi) instead of 1 to -1 (in phase to out of phase).
@Keith
IMHO, I don't believe Igor's Nixie bargraphs are compatibile with your SSL bargraphs.
@John
You mentioned flourescent displays (not plasma bargraphs) in your post. Any tips on where to source those would be greatly appreciated.
Regards,
Milan
G
Guest
Guest
[quote author="moamps"]
IMHO, I don't believe Igor's Nixie bargraphs are compatibile with your SSL bargraphs.
[/quote]
IN-9, or IN-13?
They were used in variacs to indicate voltage (tube BW TVs were unstable and picture depended on voltage, so such variacs were used).
IMHO, I don't believe Igor's Nixie bargraphs are compatibile with your SSL bargraphs.
[/quote]
IN-9, or IN-13?
They were used in variacs to indicate voltage (tube BW TVs were unstable and picture depended on voltage, so such variacs were used).
[quote author="moamps"]
@John
You mentioned flourescent displays (not plasma bargraphs) in your post. Any tips on where to source those would be greatly appreciated.
Regards,
Milan[/quote]
That just happens to be technology that was available to me over 25 years ago... today I would be starting with a blank sheet of paper just like you.
I don't know how IGORs display works but I had to not only multiplex my 100 segments 10x10, but to get a continuous bar and then a floating segment required multiplexing 10x10x3. One hit for full blocks of ten, one for the partial block of 10, and one for the lone segment floating above. Since I generated my crude log A/D from a clock, counter, and exponential ramp, I just divided everything down from one clock and multiplexed it 10x10x4 and either left it dark for one interval, or hit the lone segment 2x. I don't recall which. Note: my idea of digital 25 years ago was a bunch of CD4000 series CMOS counters and such.
It's a shame the company I designed that for was financially flaky. That would have been fun to see a full meter bridge of those puppies.
JR
cannikin
Well-known member
Very Cool -- I want one
Thanks god for my 30" monitor so I can see the entire Picture without scrolling.
:grin:
Thanks god for my 30" monitor so I can see the entire Picture without scrolling.
:grin:cannikin
Well-known member
Ok .... just watched the video - know I REALLY want one
bcarso
Well-known member
This is not a pipe.
clintrubber
Well-known member
Beautiful !
[quote author="SSLtech"]-Can I buy the PCB's from you to make one???[/quote]
Hmmm ! :grin: :razz:
Regards,
Peter
[quote author="SSLtech"]-Can I buy the PCB's from you to make one???[/quote]
Hmmm ! :grin: :razz:
Igor you're a nice example of less posts and more gear :thumb:VERY well done, BTW. -Whenever I see "Igor" at the head of a new thread, I always say "oh-oh... this is going to be impressive!"
Regards,
Peter
clintrubber
Well-known member
[quote author="JohnRoberts"]I combined the PK and RMS together onto one display http://www.patentgenius.com/patent/4166245.html .[/quote]
It made me looking for some ready-to-go peak- & rms-circuits. Found for instance these:
http://www.dorrough.com/dorrough/techdoc/download/Manual 40A(85)(1a).pdf
http://www.dorrough.com/dorrough/techdoc/download/Schematic 40A(85)(3a).pdf
(These names don't work, so go here & get them from there if interested)
FWIW, I realized that it'd wouldn't be too difficult to add such dual level-metering to for instance comp/lims with peak/rms-modes (3630 etc); the detector-circuits already there.
Regards,
Peter
Agreed... a compressor would be a perfect product to benefit from a meter that indicates crest factor or how dynamic a signal is in real time. I wanted to add this to comps at my old day gig but it was a little too advanced for a customer who wanted mostly same as but cheaper.
This was the first time I think I saw under the hood of a Dorrough but I was well aware of the product :sad: . I did prototype up one peak/VU meter using the 3914/15 meter chip years ago. I used the dB linear scale version (3915?). I found the chip was fast enough that I could electronically multiplex between dot and bar mode and Pk/VU inputs so I could do both functions with one chip. I never used that design for anything because 10 leds (30dB) was marginal to display FS to adequately below 0VU. In a comp it might be OK to not indicate all the way up to clipping (its a comp right?).
Most meters I did used 339 quad comparators or sometimes cheap opamps with diode steering.
JR
clintrubber
Well-known member
[quote author="JohnRoberts"]Agreed... a compressor would be a perfect product to benefit from a meter that indicates crest factor or how dynamic a signal is in real time. I wanted to add this to comps at my old day gig but it was a little too advanced for a customer who wanted mostly same as but cheaper.
This was the first time I think I saw under the hood of a Dorrough but I was well aware of the product :sad: . I did prototype up one peak/VU meter using the 3914/15 meter chip years ago. I used the dB linear scale version (3915?).
I never used that design for anything because 10 leds (30dB) was marginal to display FS to adequately below 0VU.[/quote]
The 3914 is the lin-type (had to look it up, I keep forgetting the differences). It's also the one Dorrough uses in the schematics we could see. As you know the 3914 can be cascaded for more LEDs.
Circuits look nice but straightforward, why are these boxes that expensive ?! :roll:
Having seen Igors video-clip I'm convinced a dual data display is the way to go (dual as in avg & peak), either combined into one bar or as two.
The floating segment of your other # looks nice as well though :thumb:
I'll check the DAW, not unlikely there's already some plugin realizing the function under discussion. That doesn't mean I don't want the hardware-equivalent, more convenient & a lot cooler to have such a thing 'for real'.
Regards,
Peter
I am more convinced than ever of the utility. Digital media and audio paths should be kept out of clipping, while average/RMS is useful for apparent loudness. Combining both in a single display (preferably oriented vertically) makes it simple to scan across a meter bridge to check headroom status, while still being able to see where the "meat" of the signal is. This combination on the 2-mix gives useful information wrt dynamics of final mix. I have seen some high end consoles with both side by side or overlayed, but those displays looked a little busy to me.. (perhaps I'm a little biased :roll: )
Probably the main reason this isn't more used is the incremental cost.. console designers get sharp pencil when costs are multiplied 24 or 36 times, and the value in such meters isn't immediately apparent. Some may not realize it's public domain and free to use.
JR
Probably the main reason this isn't more used is the incremental cost.. console designers get sharp pencil when costs are multiplied 24 or 36 times, and the value in such meters isn't immediately apparent. Some may not realize it's public domain and free to use.
JR
clintrubber
Well-known member
[quote author="JohnRoberts"]Probably the main reason this isn't more used is the incremental cost.. console designers get sharp pencil when costs are multiplied 24 or 36 times, and the value in such meters isn't immediately apparent. Some may not realize it's public domain and free to use. [/quote]
I guess there'd be a market for a new type to add to the 3914/3915/3916-range. All the per-LED-hassle could be put inside. Then the added cost would reduce to adding an averaging circuit.
There is already a second function in many a mixer-LED-bar though:
the temp-sticky peak-dot (the exact wording escapes me for now). So maybe it may be too late for better functionality now all those mixers with the sticky dot are already out there...
Regards,
Peter
Similar threads
- Replies
- 3
- Views
- 464