EZTube UA 610 EQ

GroupDIY Audio Forum

Help Support GroupDIY Audio Forum:

This site may earn a commission from merchant affiliate links, including eBay, Amazon, and others.
You need to apply some windowing and pre-processing in order to transform that into a frequency response that you can read. A simple FFT would not do it...
 
dmnieto said:
You need to apply some windowing and pre-processing in order to transform that into a frequency response that you can read. A simple FFT would not do it...

Can you suggest the code to do this? I am a total noob in this area.


Cheers

 
A bit complicated actually, what you are trying to do is to get the spectral density of a chirp http://en.wikipedia.org/wiki/Chirp

The easiest way to visualize it without knowing anything about the sweep is to use an spectrogram. Which you can see with the scilab function mapsound() https://help.scilab.org/docs/5.3.3/en_US/mapsound.html

I don't know how you generated the sweep, but in most cases you probably used a discrete upwards chirp. That means that you played a sinusoid for a number of samples, and the changed to the next frequency on a zero crossing. Can you describe how you generated the chirp? I may be able to give you a better explanation.

Do you mind doing a plot of the... i dont know, the first two seconds of the wavfile? just do a plot(s, 44100*4);
 
Hi Ian,

finally, I found some time to test with MATLAB.
Totally forgot about the window size et al.

Here are 9 lines that basically come from
MATLAB's documentation:
Code:
[y, Fs, nbits] = wavread('testfile');
T = 1/Fs;
L = length(y);
t = (0:L-1)*T; 
plot(Fs*t,y);
NFFT = 2^nextpow2(L);
Y = fft(y,NFFT)/L;
f = Fs/2*linspace(0,1,NFFT/2+1);
plot(f,2*abs(Y(1:NFFT/2+1)));
I would suggest to test with small parts of your audio file first.
The lines 1 - 5 should give you a plot of the audio.

Maybe some adoption for correct SCILAB syntax as needed.

Cheers,
Carsten
 
culteousness1 said:
Hi Ian,

finally, I found some time to test with MATLAB.
Totally forgot about the window size et al.

Here are 9 lines that basically come from
MATLAB's documentation:
Code:
[y, Fs, nbits] = wavread('testfile');
T = 1/Fs;
L = length(y);
t = (0:L-1)*T; 
plot(Fs*t,y);
NFFT = 2^nextpow2(L);
Y = fft(y,NFFT)/L;
f = Fs/2*linspace(0,1,NFFT/2+1);
plot(f,2*abs(Y(1:NFFT/2+1)));
I would suggest to test with small parts of your audio file first.
The lines 1 - 5 should give you a plot of the audio.

Maybe some adoption for correct SCILAB syntax as needed.

Cheers,
Carsten

The FFT still won't give you the correct response... it will give you FFT(H(s)*X(s)) where X(s) is the response of the chirp function, while H(s) is what he is looking for.

The wav he has is the output of the chirp function through the EQ, so unless he manages to find the original wav or the formula that generated the chirp it will not work very well. I expect is to be either a discrete or continuous log or linear chirp. A plot of the wav in the time domain will help a lot to determine what the signal was
 
dmnieto said:
The wav he has is the output of the chirp function through the EQ, so unless he manages to find the original wav or the formula that generated the chirp it will not work very well. I expect is to be either a discrete or continuous log or linear chirp. A plot of the wav in the time domain will help a lot to determine what the signal was

The original sweep was made using Protools. It was done by another group member who has a 2-610 and kindly agreed to do it for ,e. I am not a Protools user so I have no idea what sweep options it has available.

Cheers

Ian
 
ruffrecords said:
The original sweep was made using Protools. It was done by another group member who has a 2-610 and kindly agreed to do it for ,e. I am not a Protools user so I have no idea what sweep options it has available.

Cheers

Ian

It had to be with some kind of plugin, protools does not have that kind of sweep generator.

For the future... these are good frequency sweeps

http://www.audiocheck.net/audiofrequencysignalgenerator_sweep.php


Let's do something, upload the wav somewhere and I will do the processing for you. Then I will share the code. I would like to play with the data to see how to infer the frequency response.
 
dmnieto said:
Let's do something, upload the wav somewhere and I will do the processing for you. Then I will share the code. I would like to play with the data to see how to infer the frequency response.

Thanks for offering to do this. The sweeps are in a file called sweeps.zip here:

http://www.ianbell.ukfsn.org/EzTubeMixer/docs/sounds/

Be aware it is 239M in size.

Cheers

Ian
 
Hi Ian,

Good news is that it is a pure chirp, so a simple envelope detection is going to be able to recover all the band.

Bad news is that it is a *linear* chip... so resolution in the low frequencies is going to suck as there is just not enough datapoints to get a frequency response without quite a lot of aliasing.

It is always better to do the analysis in a log chirp but I'll do what I can
 
dmnieto said:
Hi Ian,

Good news is that it is a pure chirp, so a simple envelope detection is going to be able to recover all the band.

Bad news is that it is a *linear* chip... so resolution in the low frequencies is going to suck as there is just not enough datapoints to get a frequency response without quite a lot of aliasing.

It is always better to do the analysis in a log chirp but I'll do what I can

Anything you can do will be worthwhile. At least the hi boost/cut sweeps should be OK. I am also trying another route using a recorded sweep from my Lindos MS10. This includes FSK tones at the beginning that tell the Lindos what sweep it is doing. The sweep is a series of third octave tones. The idea is it can be used where there is a significant time delay between the input and output of a system. We have tried a single sweep and that seems to work so with luck I may get two sets of results.

Cheers

Ian
 
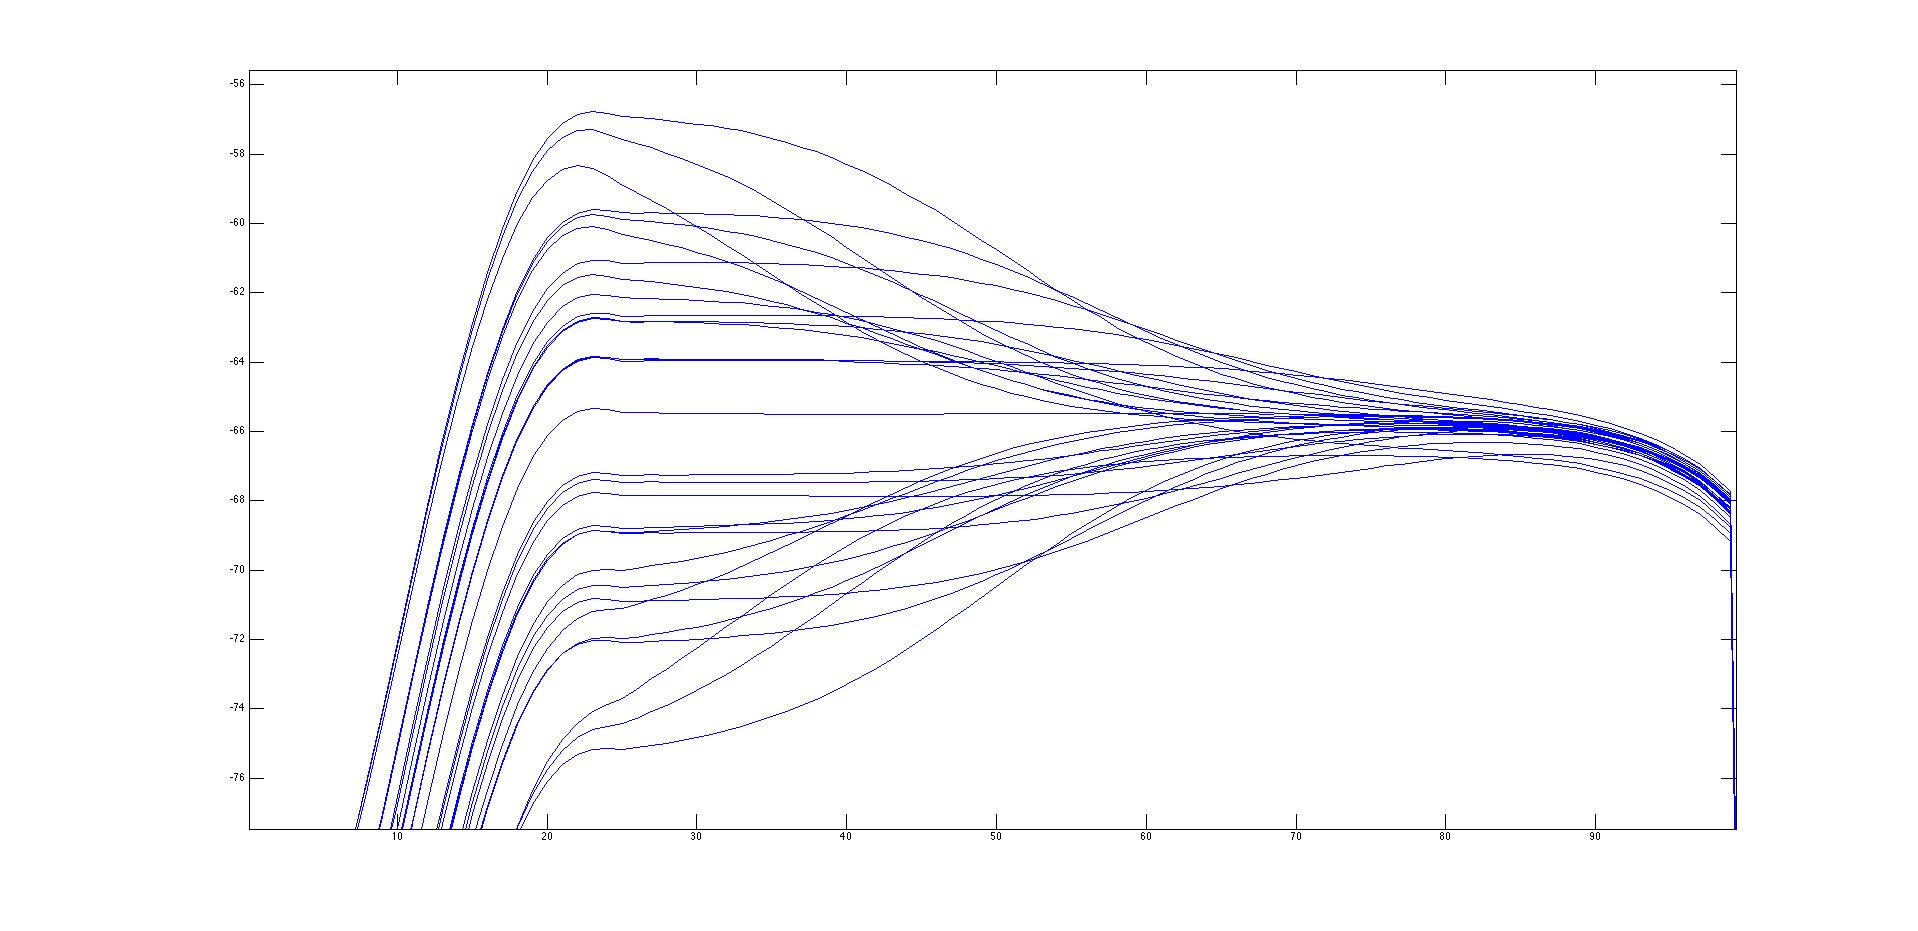
So Ian, sorry that it took me some time. I have started to do the analysis... and as I expected there is not enough data to make an accurate estimation of anywhere lower that 70Hz... I cannot differentiate if the roll-off is due to the UA or if the issue is the lack of points...

I have attached a plot of the low shelf frequency response. If you still want it I can give you the frequency response values for everything (high and low)... Do you want them in frequency linear or frequency log form? How many datapoints?

BTW, do not check to much the horizontal scale... it is tabulated for log-frequency.. there is a total of 100 point where the first point is 20Hz and the last one 20KHz

BkeNcbf.jpg
 
dmnieto said:
So Ian, sorry that it took me some time. I have started to do the analysis... and as I expected there is not enough data to make an accurate estimation of anywhere lower that 70Hz... I cannot differentiate if the roll-off is due to the UA or if the issue is the lack of points...

I have attached a plot of the low shelf frequency response. If you still want it I can give you the frequency response values for everything (high and low)... Do you want them in frequency linear or frequency log form? How many datapoints?

BTW, do not check to much the horizontal scale... it is tabulated for log-frequency.. there is a total of 100 point where the first point is 20Hz and the last one 20KHz

Thank you very much for taking the time to do this.  As the information at the low end is suspect I suggest we concentrate on the high boost/cut curves. A log frequency and amplitude scales would be best for me for estimating turn over frequencies and slopes. I don't know if data points are spaced linearly or not but when I do a spice sim I usually set it for 20 points per octave. As 20Hz ro 20KHz is close to 10 octaves I guess 200 data points would be about right.

Once again, thanks very much for doing this. It is much appreciated.

Cheers

Ian
 
ruffrecords said:
Thank you very much for taking the time to do this.  As the information at the low end is suspect I suggest we concentrate on the high boost/cut curves. A log frequency and amplitude scales would be best for me for estimating turn over frequencies and slopes. I don't know if data points are spaced linearly or not but when I do a spice sim I usually set it for 20 points per octave. As 20Hz ro 20KHz is close to 10 octaves I guess 200 data points would be about right.

Once again, thanks very much for doing this. It is much appreciated.

Cheers

Ian

Don't mention it Ian, this group is giving me so much that I have to jump at any opportunity to contribute :)

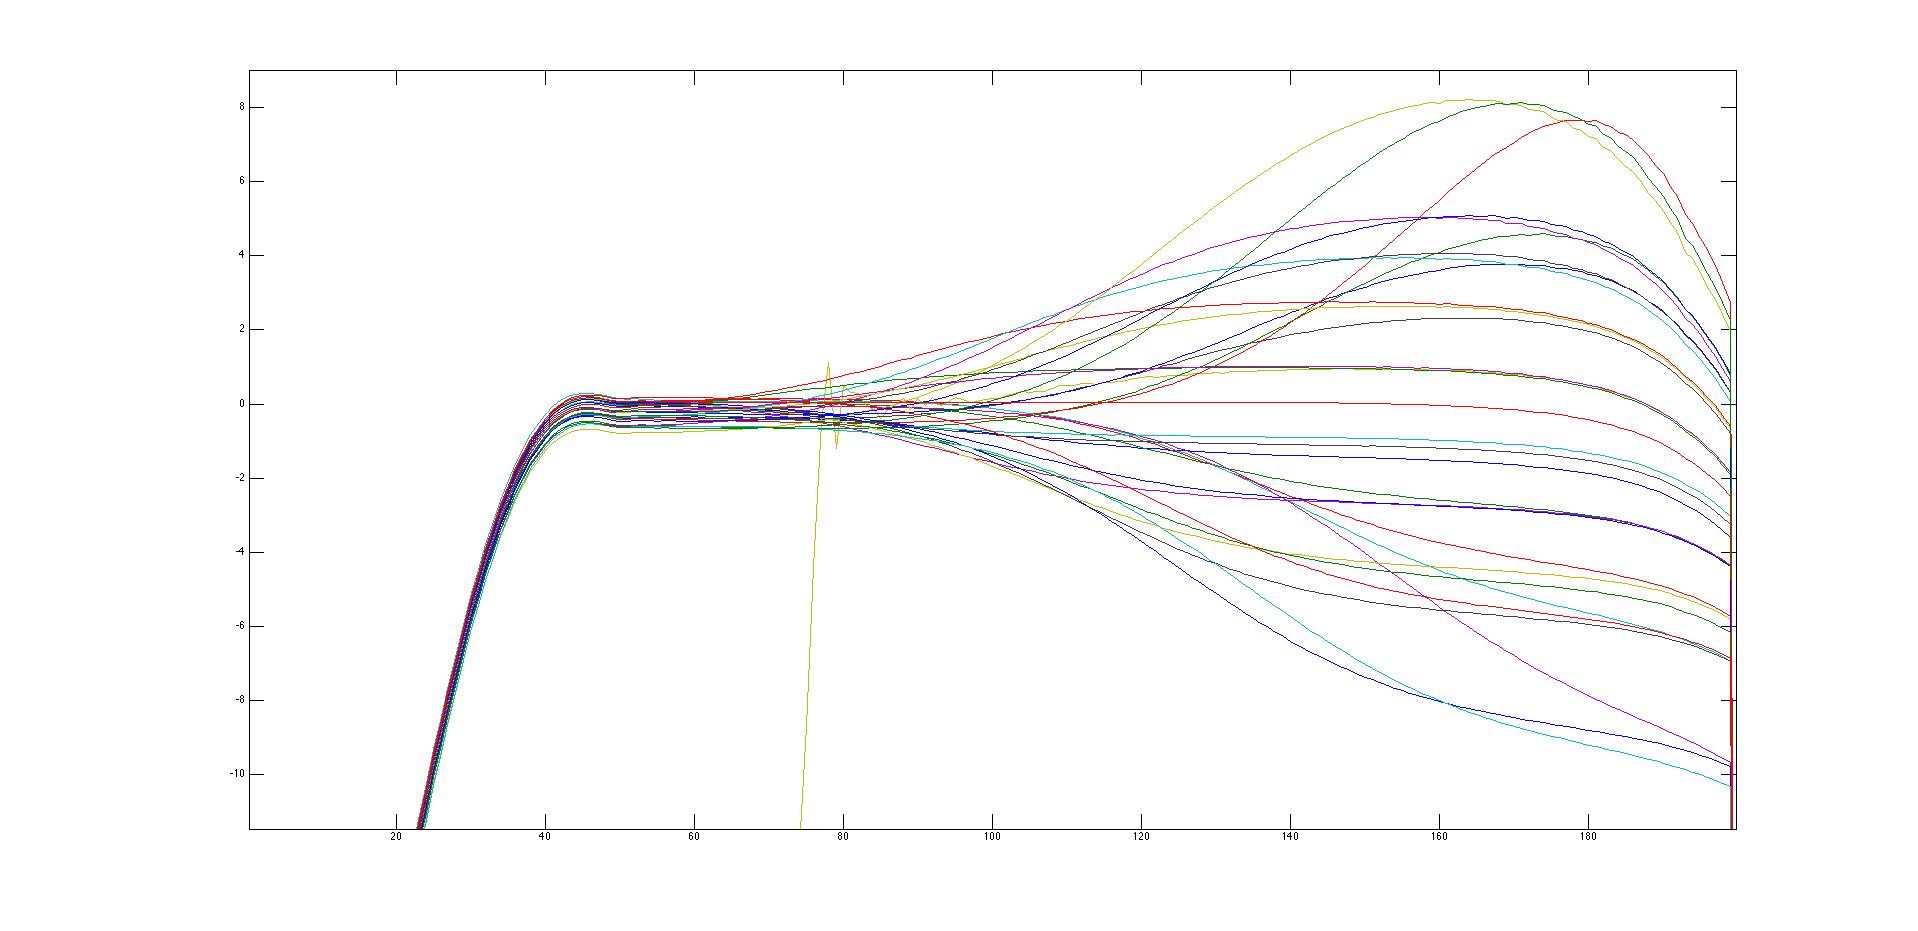
A couple of comments:
(1) The +1.5dB 10KHz sweep was truncated, so ignore all the info below 350Hz for that plot.
(2) There is a normalization blur of +/-0.5dB between traces because of the processing I used and the uncertainties of the source files (sorry). Use the r_flat as a baseline and  calibrate the plots before use for a known frequency I recommend the 102Hz data point (index 48).
(3) The files are stored both in .mat and .m format, you can import them into scilab with loadmatfile for additional processing. The .m file is an easy to read ASCII file
(4) f1 is the frequency vector.

If you get any new plots give me a shout... But for your info the magic is something called "spectrogram" that basically splits the signal into portions of around 8000 datapoints with a 50% overlap and a Hanning window and then distributes them over the spectrum, the you apply the goertzel algorithm to calculate the DFT components.
For the future, I recommend generating the sweep in logarithmic form at 192KHz (4x upsampling) to get  bit more of resolution.
2iECVV3.jpg


The files are here:
http://suenram.us/share/high_freq_analysis.zip

the files are here:


I have done some initial hand manipulation of part of the data to get it into a format I am familiar with. Attached are the 10K boost sweeps at 3dB intervals. I am a bit concerned about the 2dB or so drop at 20KHz. I don't know if this is the actual response of the 610 or a side effect of the sampling rate and data manipulation. Even if you take out the 20K drop, the boost curves still look more like resonant ones than shelving ones. They look very similar to the 10K boost curves of my REDD EQ design. Interestting.

Cheers

Ian
 

Attachments

  • 10Kboostplot.png
    10Kboostplot.png
    45 KB
It has been a while since I looked at this. However, on another forum, someone asked about a tube mic pre that could also be used as an RIAA preamp. I told them about the EZTubeMixer mic pre and suggested the RIAA EQ could be done entirely in the gain setting arm of the second amp. It then occurred to me that we could probably do the UA610 EQ in exactly the same way. Part of the reason I have not taken this EQ much further is that the method I was using required switching in the dc feedback path of the amplifier which is a recipe for introducing clicks. However, if you do the lot in the gain setting arm of the NFB, between the cap and ground then there is no dc to worry about. Next step is to do some sims to see if this approach is viable.

Cheers

Ian
 
I have a UA LA610-II and an Audio Precision System One. This is a combo of the UA610 preamp and an LA-2 compressor.

If it is helpful, I can run a family of curves for the equalizer.
 
rickc said:
I have a UA LA610-II and an Audio Precision System One. This is a combo of the UA610 preamp and an LA-2 compressor.

If it is helpful, I can run a family of curves for the equalizer.

That would be absolutely wonderful! It would say me a lot of number crunching. Can you email them to me at :

ianbellATukfsnDOTorg

Cheers

Ian
 

Latest posts

Back
Top