Bo Deadly
Well-known member
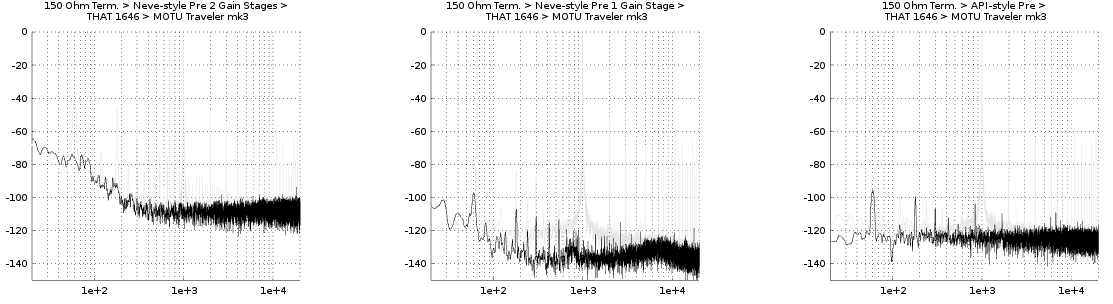
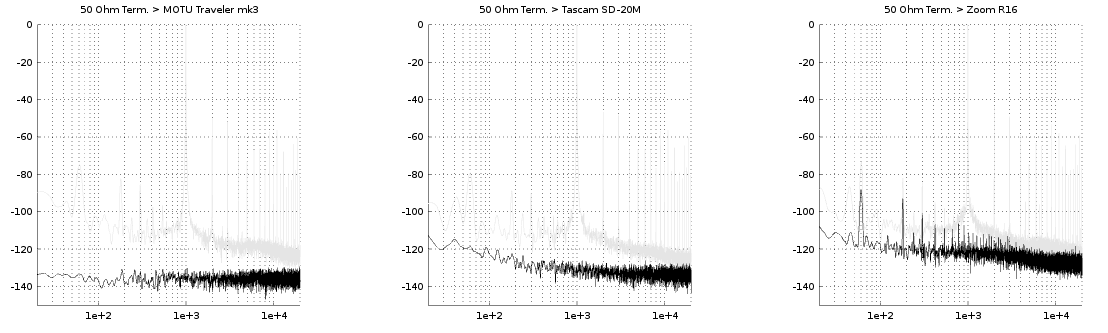
I wanted to compare performance of my recording rig with 3 digital recorders (MOTU Traveler mk3, Zoom R16 and Tascam SD-20M) so I thought I would plot the noise spectra using GNU Octave and post the results. The below Octave script averages together many spectra from the stft function (short-time Fourier transform) and does a little filtering with sgolayfilt to bring out the peaks. Octave (and it's inspiration Matlab) can generate extremely high quality plots.
To generate the wav file, send the DUT a reference tone (I used 1kHz) and adjust the level to 0dBFS (aka "Full-Scale"). Listen to find the threshold of clipping. Record 10 sec of the ref. tone. Then turn off the ref tone and terminate the input of the DUT. Record another 10 sec of this "silence". Add that now ~20s wav file to the below script and viola - awesome detailed spectrum. Adjust to taste.
For example, here is a series of spectra that compare the noise floors of 3 consumer digital recording devices:
The
Octave / Matlab script:
To generate the wav file, send the DUT a reference tone (I used 1kHz) and adjust the level to 0dBFS (aka "Full-Scale"). Listen to find the threshold of clipping. Record 10 sec of the ref. tone. Then turn off the ref tone and terminate the input of the DUT. Record another 10 sec of this "silence". Add that now ~20s wav file to the below script and viola - awesome detailed spectrum. Adjust to taste.
For example, here is a series of spectra that compare the noise floors of 3 consumer digital recording devices:
The
Code:
noise.m
Code:
[SIZE=13px]pkg load signal

clear all;
close all;

function [f, s, m] = wavfft(filename, chan, offset, nfft, nmult)

    [y, fs] = audioread(filename, [1, 2]);
    osam = offset * fs;

    [y, fs] = audioread(filename, [osam, osam + nfft]);
    y = y(:, chan);

    s = stft(y, 80 * nmult, 24 * nmult, 64 * nmult, 1);
    s = mean(s, 2);
    s = 20*log10(s);
    s = sgolayfilt(s, 5, 21);
    m = max(s);

    n = length(s);
    f = fs*(0:n-1)/n/2;

endfunction

function pltwavfft(filename, chan, offset_reftone, npow, nmult, rgb)

    hold on

    [f, s, m] = wavfft(filename, chan, offset_reftone + 0, 2^npow, nmult);
    s = s .- m; # adjust 0dB to peak of test tone
    semilogx(f, s, 'color', [0.9, 0.9, 0.9]);

    [f, s, x] = wavfft(filename, chan, offset_reftone + 10, 2^npow, nmult);
    s = s .- m; # adjust 0dB to peak of test tone
    semilogx(f, s, 'color', [0, 0, 0]);

    axis([20 20000 -150 0])
    grid on

endfunction

subplot(1, 3, 1);
pltwavfft('NoiseStep_Traveler_5.wav', 1, 3, 16, 512, [0.1, 0.1, 0.1])
title('50 Ohm Term. > MOTU Traveler mk3');
subplot(1, 3, 2);
pltwavfft('NoiseStep_TascamSD20M_50r.wav', 1, 3, 16, 512, [0.1, 0.1, 0.1])
title('50 Ohm Term. > Tascam SD-20M');
subplot(1, 3, 3);
pltwavfft('NoiseStep_ZoomR16_50r_sox.wav', 1, 3, 16, 512, [0.1, 0.1, 0.1])
title('50 Ohm Term. > Zoom R16');[/SIZE]