Bo Deadly
Well-known member
I needed a quick and dirty way to confirm my custom 1176 board was working.
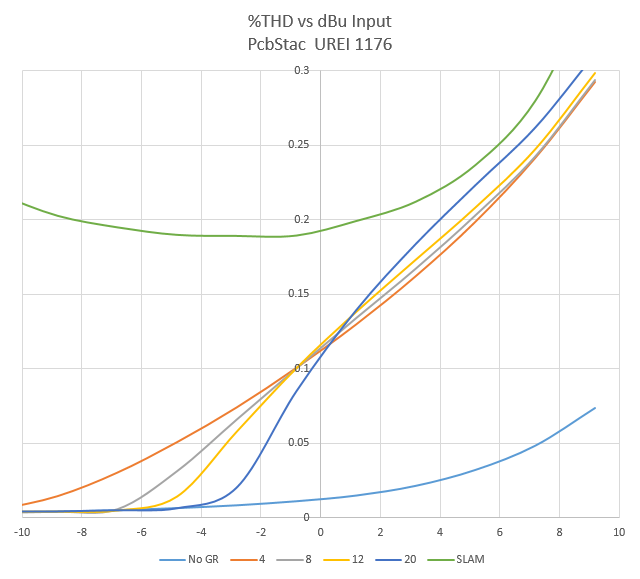
If you happen to have a QuantAsylum QA400 it has a macro called THD vs Output Level. Here is a plot of that macro for each ratio:

You can see clearly the ratios are indeed working as expected. Very easy!
More specifically, I used the following macro parameters:
Level:
Start -20 dB
End 0 dB
Step 2 dB
Freq:
Start 200
End 2000
Per Oct 2
Attack and release we set full CW.
I saved each CSV file for each ratio (No gain reduction, 4:1, 8:1, 12:1, 20:1, SLAM) and then imported them into Excel.
I measured the exact level on the wiper of the input level control with the QA400 output set to -10 dBV. Turned out to be 2.0 Vpp or -0.8 dBu.
I created a new table with all of the 1.1kHz columns and adjusted to dBu using said measured value.
Then I just inserted a scatter plot.
Of course the THD values themselves are somewhat meaningless. But if we assume that THD reflects the amount of compression, then the curves can be compared to give a meaningful result. Visually it's quite clear that it's working.
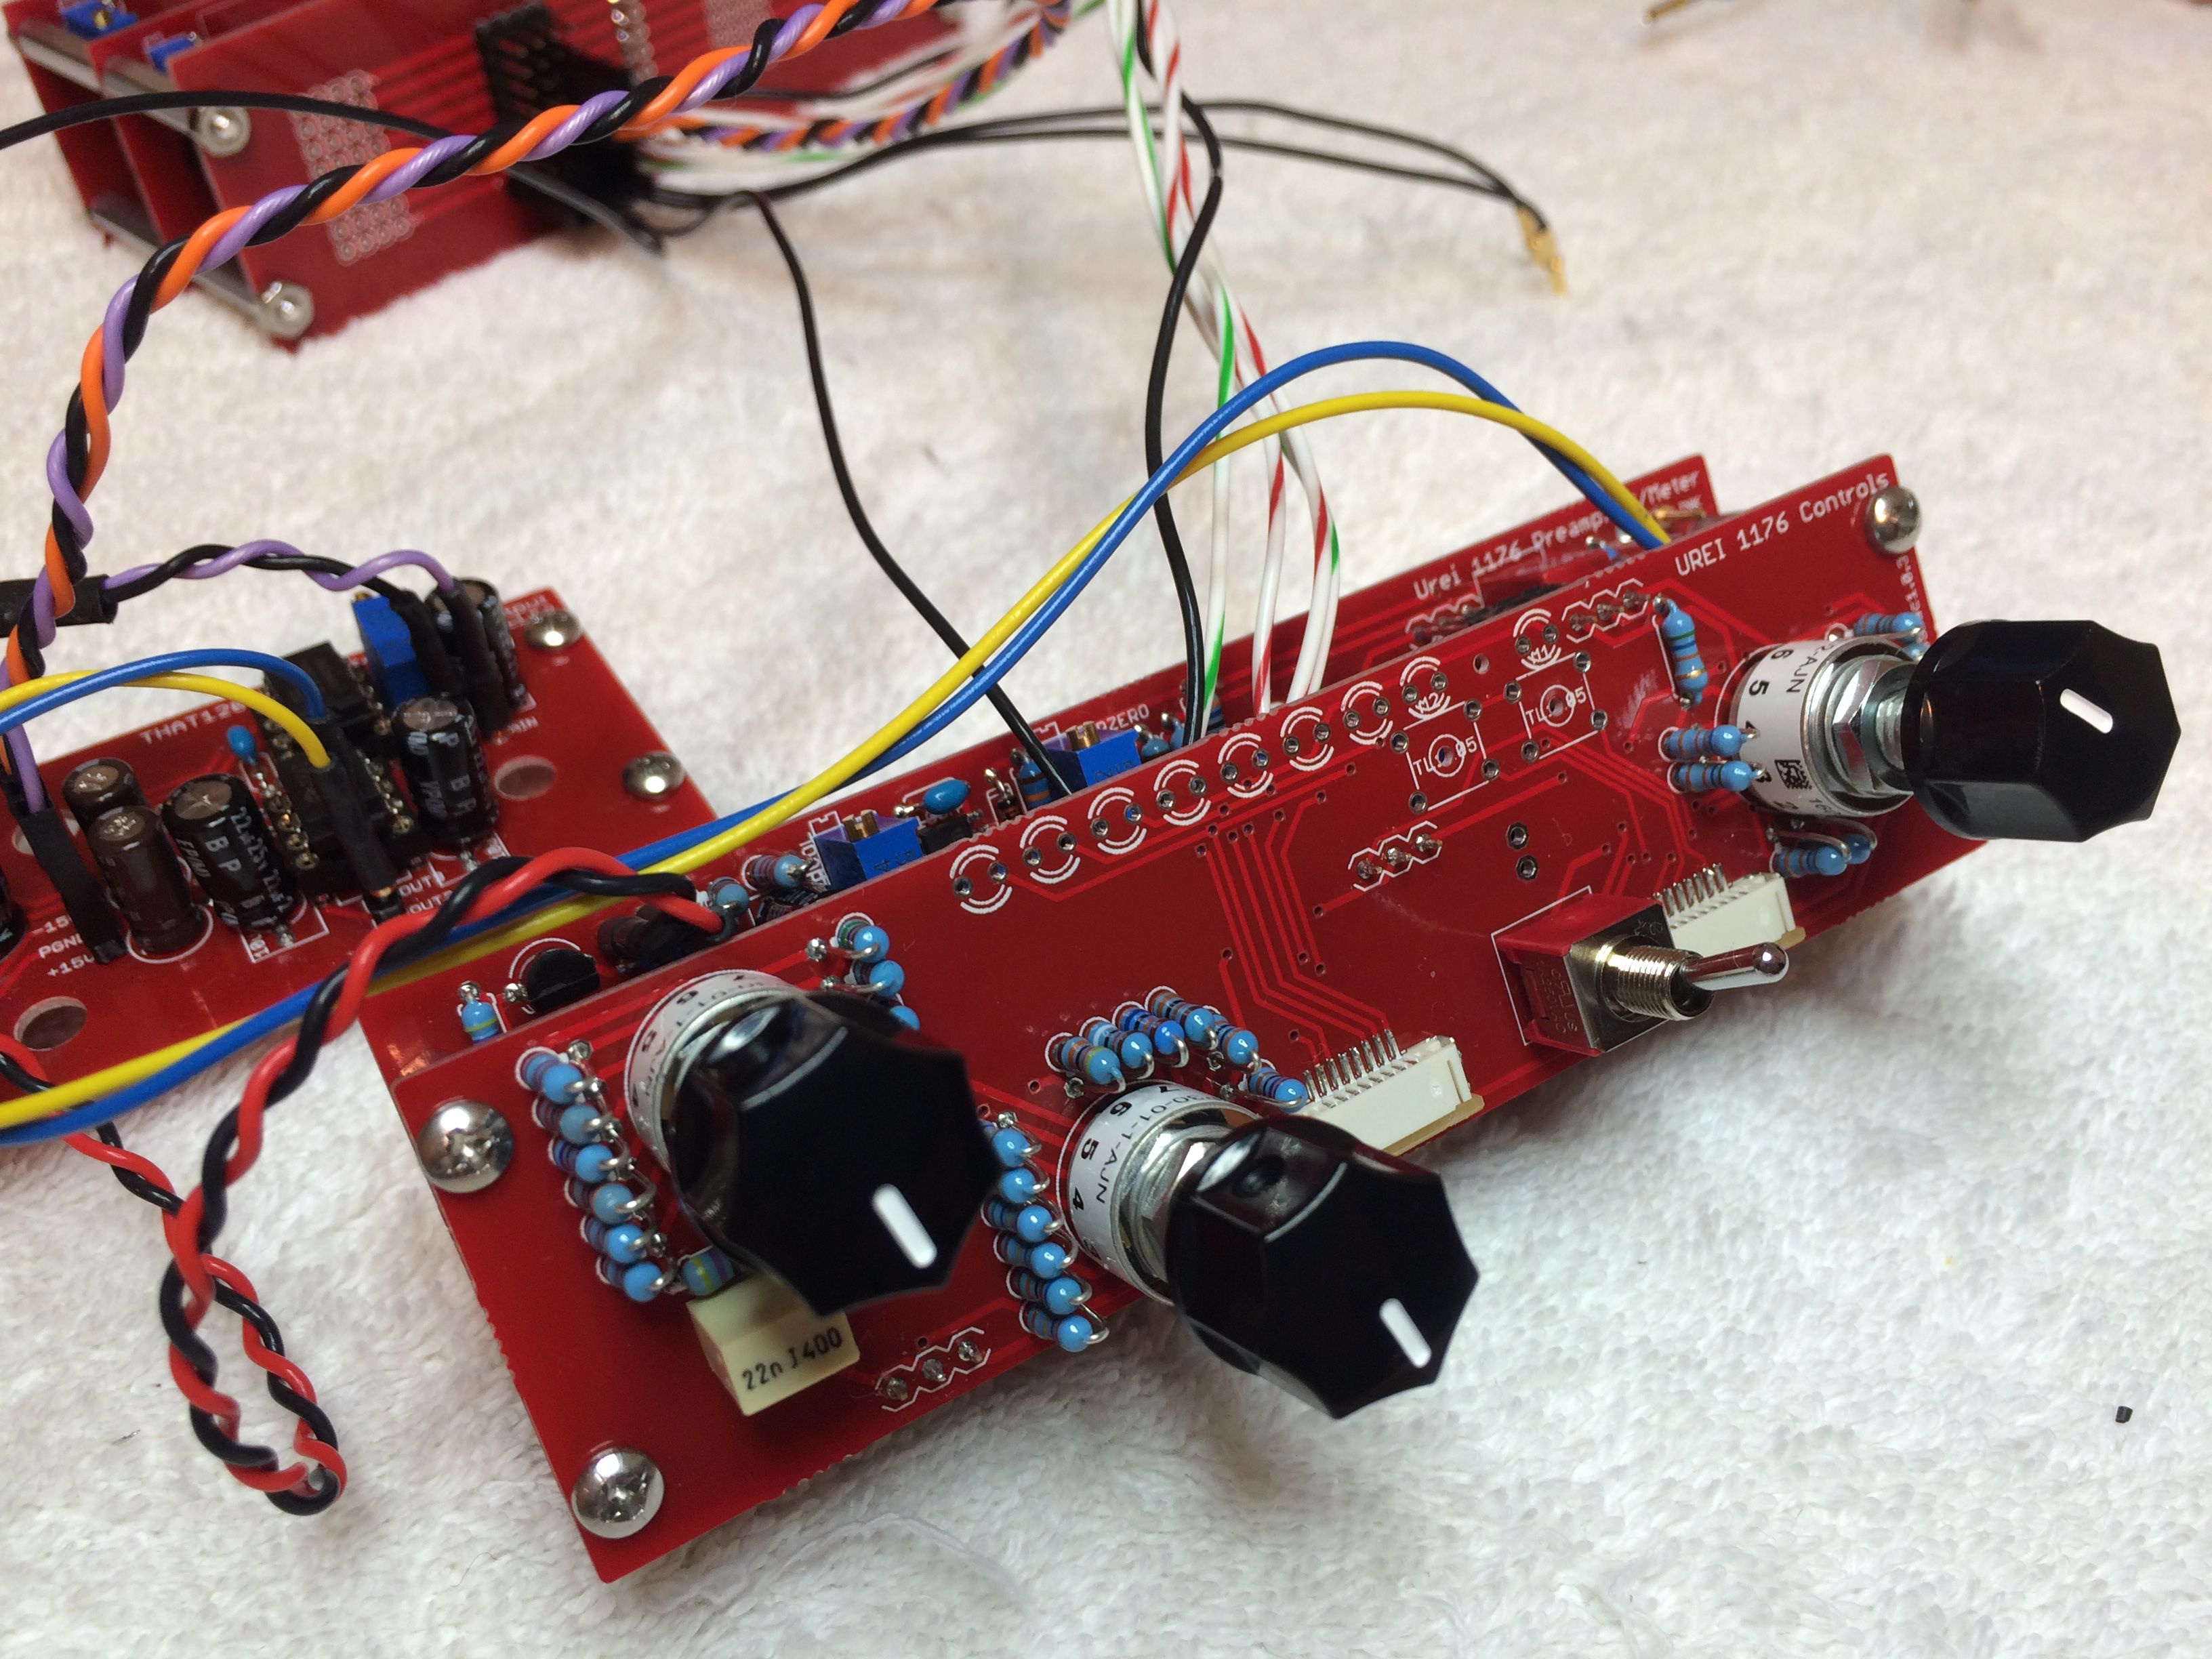
Incidentally here's a pic of my 1176 board:

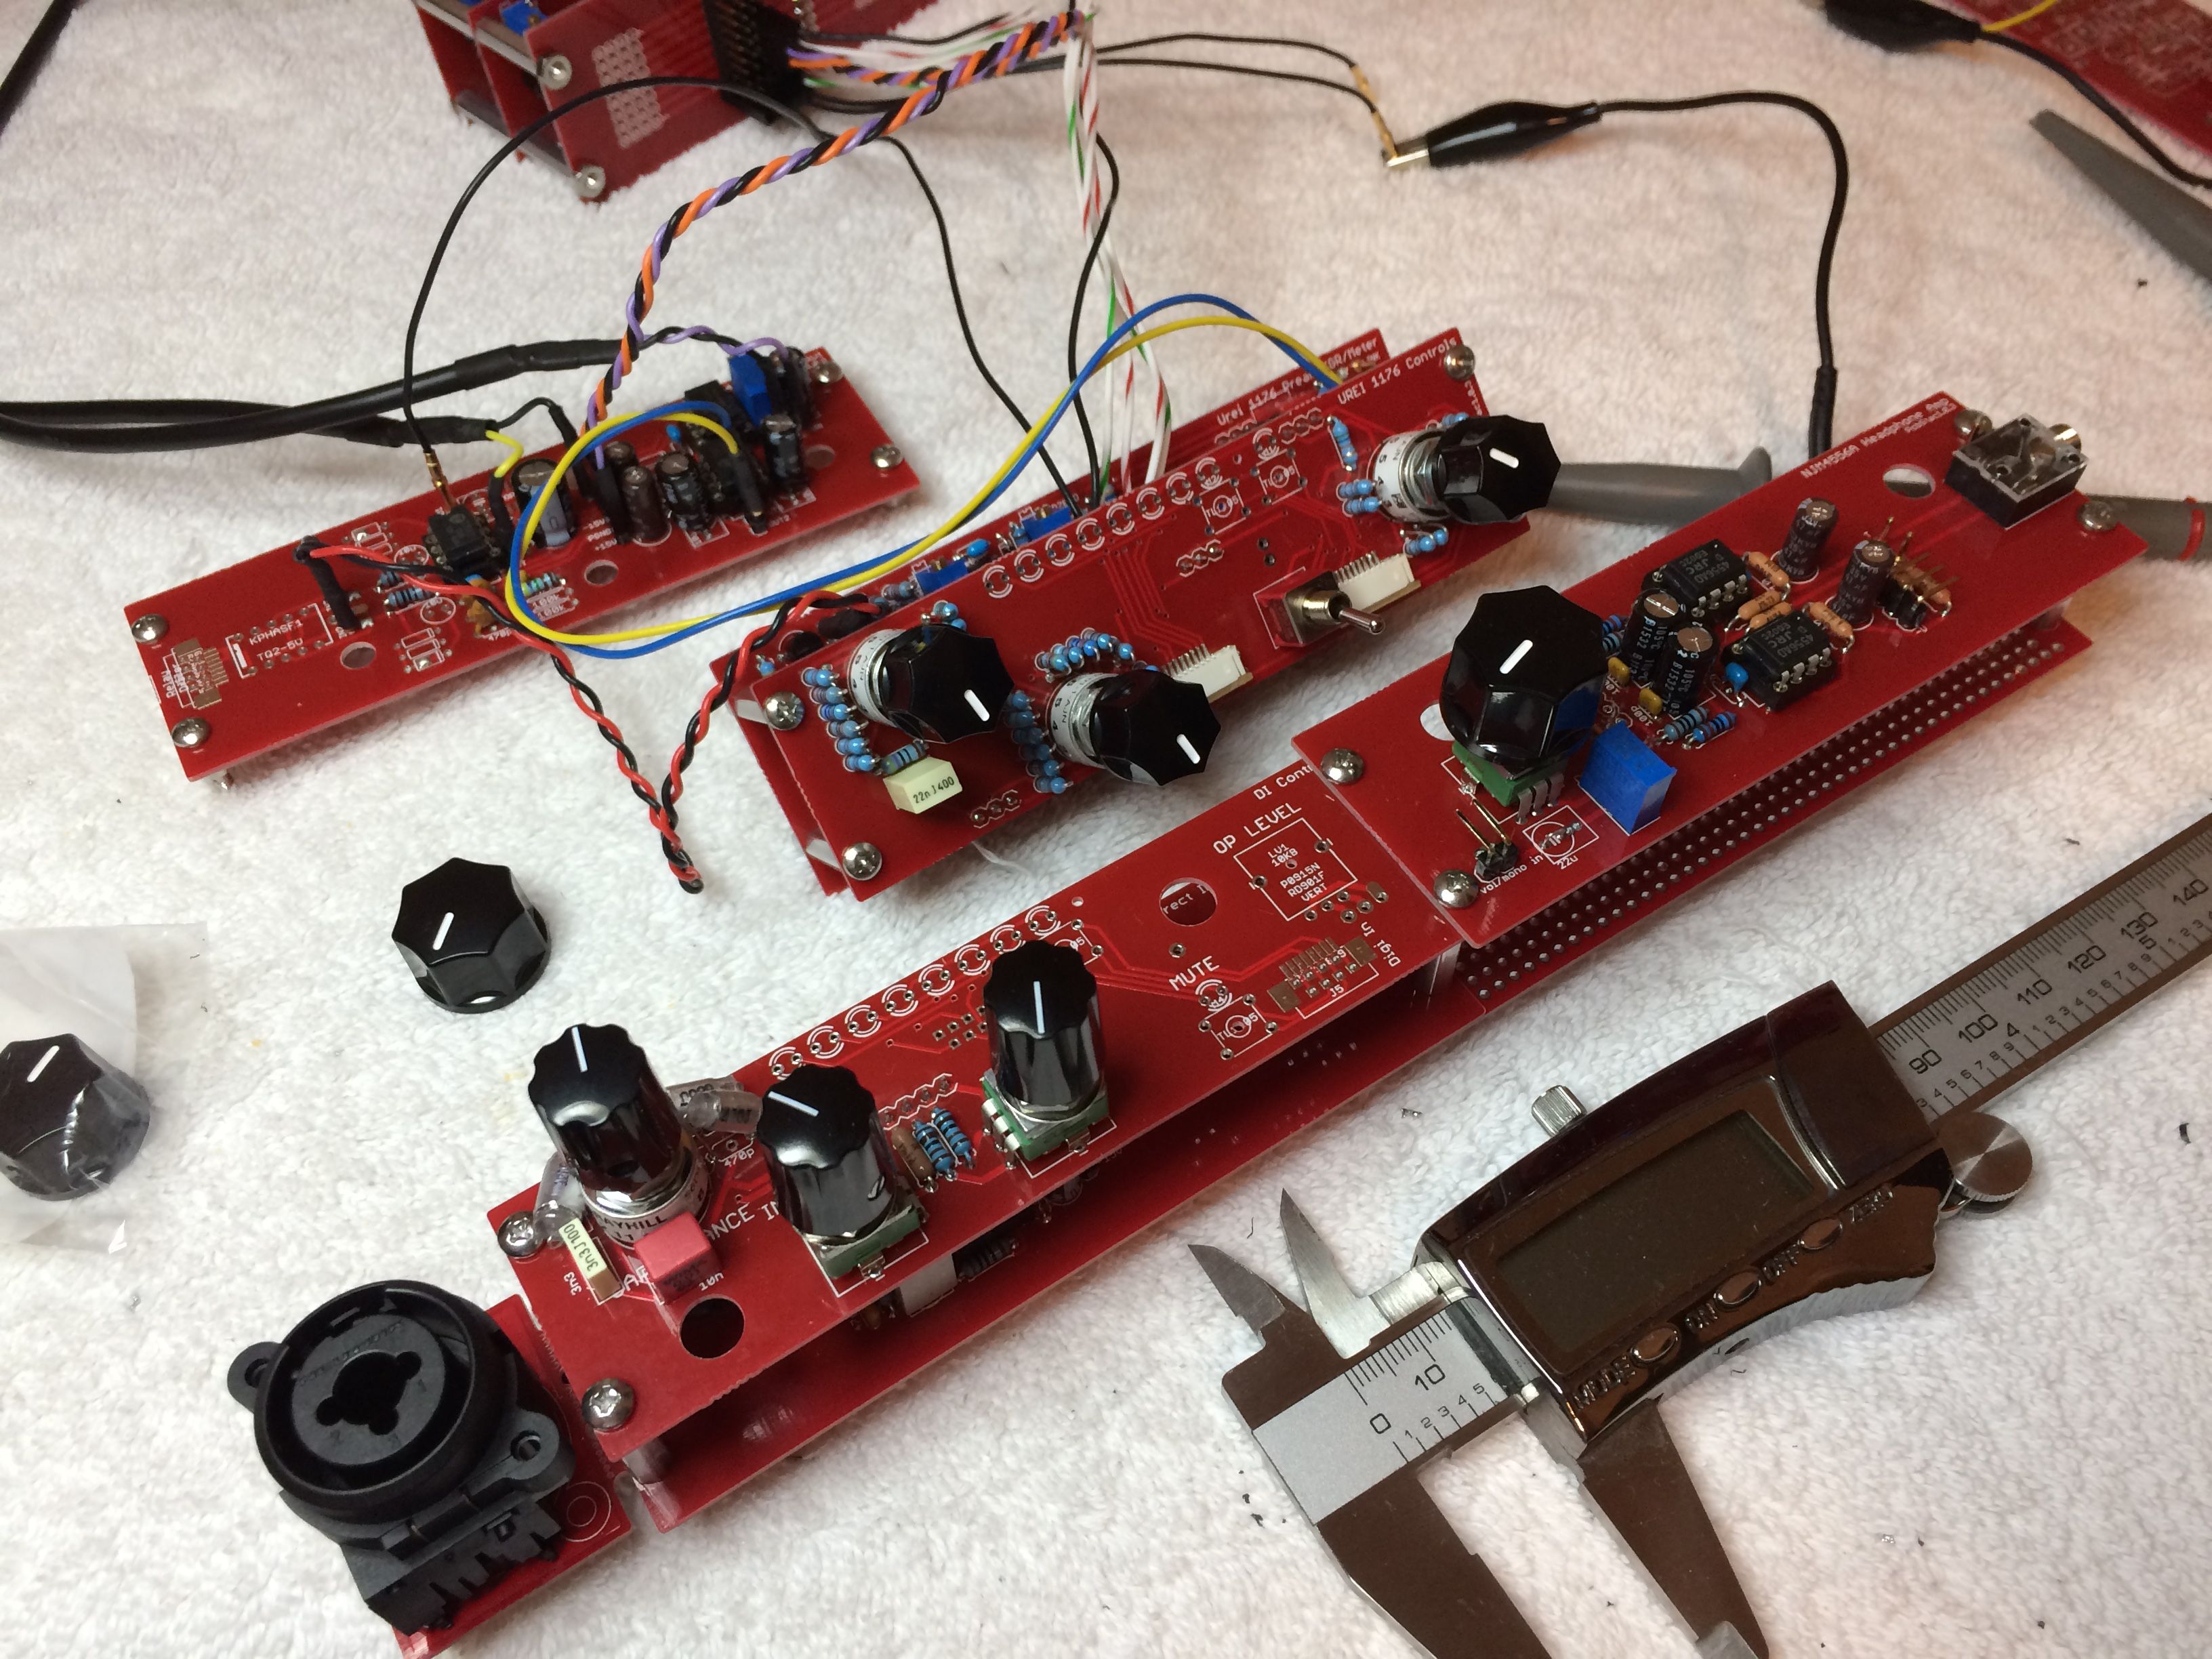
The preamp, GR, meter driver and controls fit in two stacked 4.7"x1.5" boards. The board to the left is a THAT1206/THAT1646 balanced IO board and the board in the background is the power board. Not a conventional build but it works.
If you happen to have a QuantAsylum QA400 it has a macro called THD vs Output Level. Here is a plot of that macro for each ratio:

You can see clearly the ratios are indeed working as expected. Very easy!
More specifically, I used the following macro parameters:
Level:
Start -20 dB
End 0 dB
Step 2 dB
Freq:
Start 200
End 2000
Per Oct 2
Attack and release we set full CW.
I saved each CSV file for each ratio (No gain reduction, 4:1, 8:1, 12:1, 20:1, SLAM) and then imported them into Excel.
I measured the exact level on the wiper of the input level control with the QA400 output set to -10 dBV. Turned out to be 2.0 Vpp or -0.8 dBu.
I created a new table with all of the 1.1kHz columns and adjusted to dBu using said measured value.
Then I just inserted a scatter plot.
Of course the THD values themselves are somewhat meaningless. But if we assume that THD reflects the amount of compression, then the curves can be compared to give a meaningful result. Visually it's quite clear that it's working.
Incidentally here's a pic of my 1176 board:

The preamp, GR, meter driver and controls fit in two stacked 4.7"x1.5" boards. The board to the left is a THAT1206/THAT1646 balanced IO board and the board in the background is the power board. Not a conventional build but it works.


