


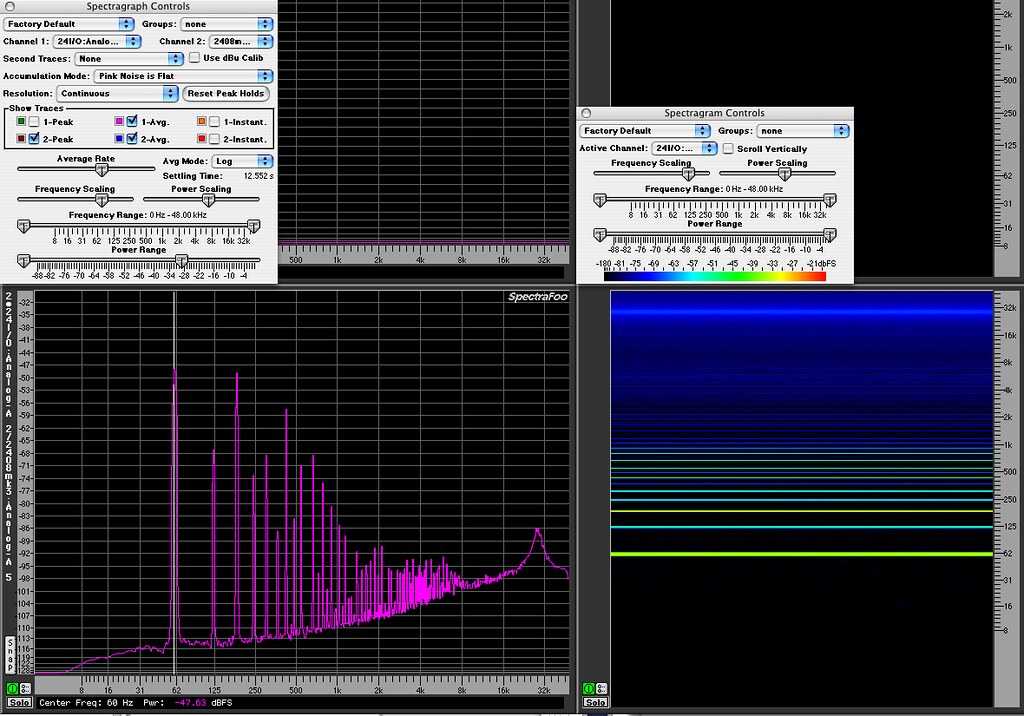
Some pre-mod plots first. No input transformer yet, or any other electrical changes. Try to ignore the squigglies in some of the plots, result of fast settling times. The last plot in this post also shows the original Collins 26C response.
You'll see we have a treble boost under compression, the Collins does not change with compression setting. At this point I suspect the boost is in the interstage transformers, due to the way they react under source, load, and GR conditions.
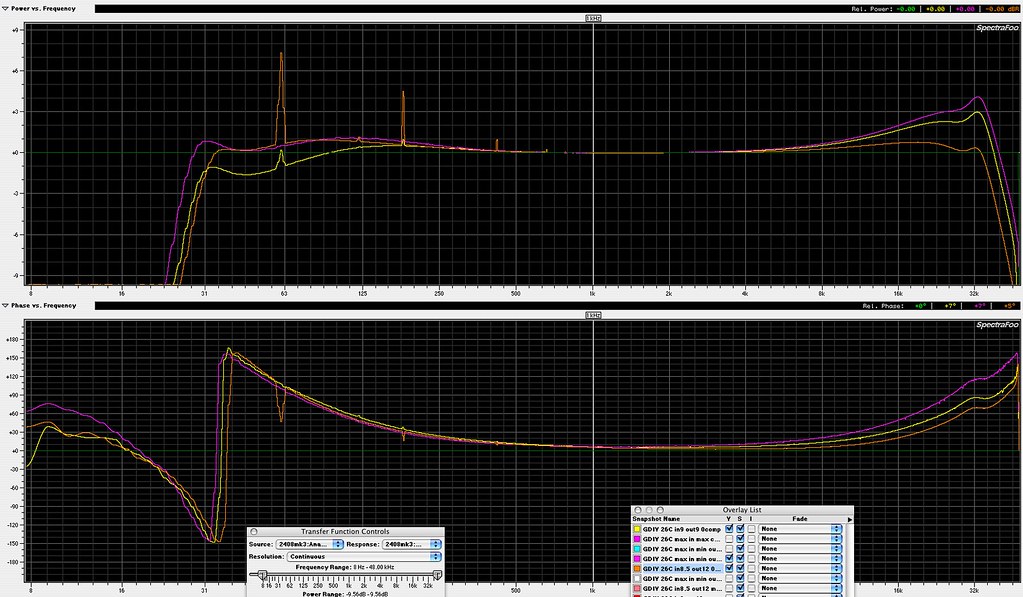
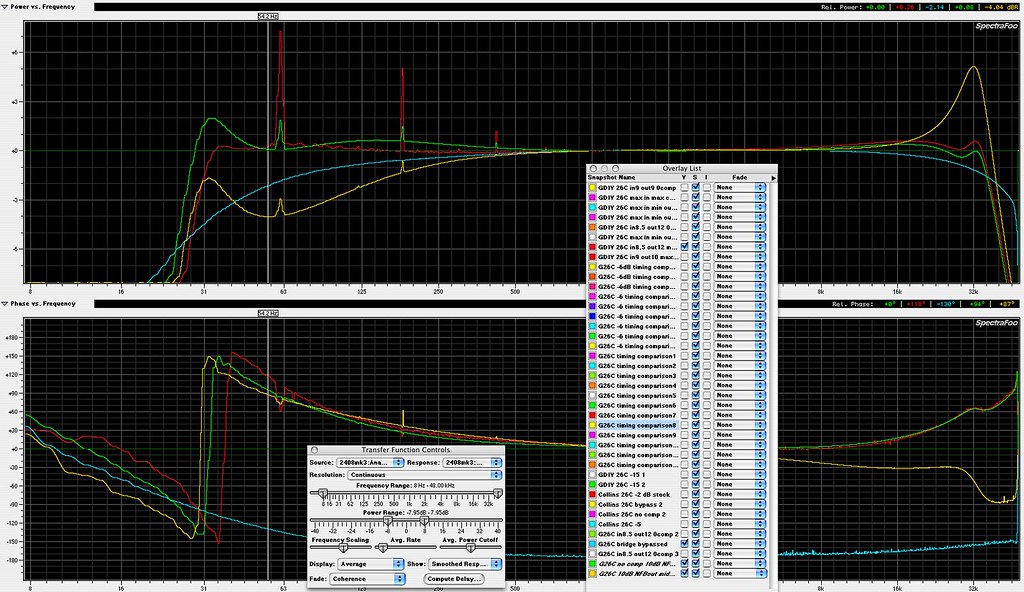
various compression timings, all set for -6 GR. This shows relative level change per setting.
Click this link for the full size plots
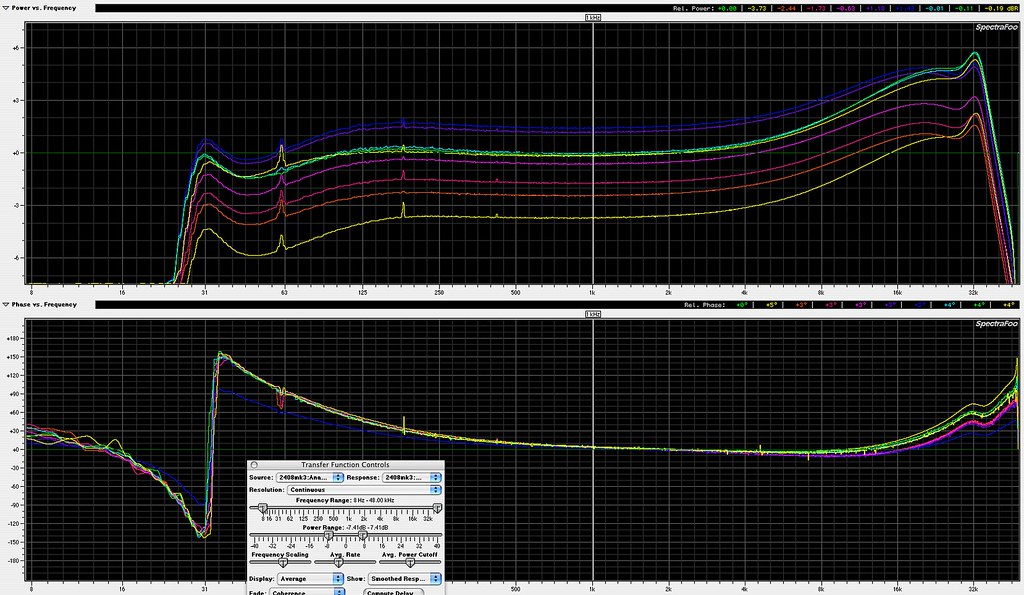
same again, 1K aligned
Click this link for the full size plots
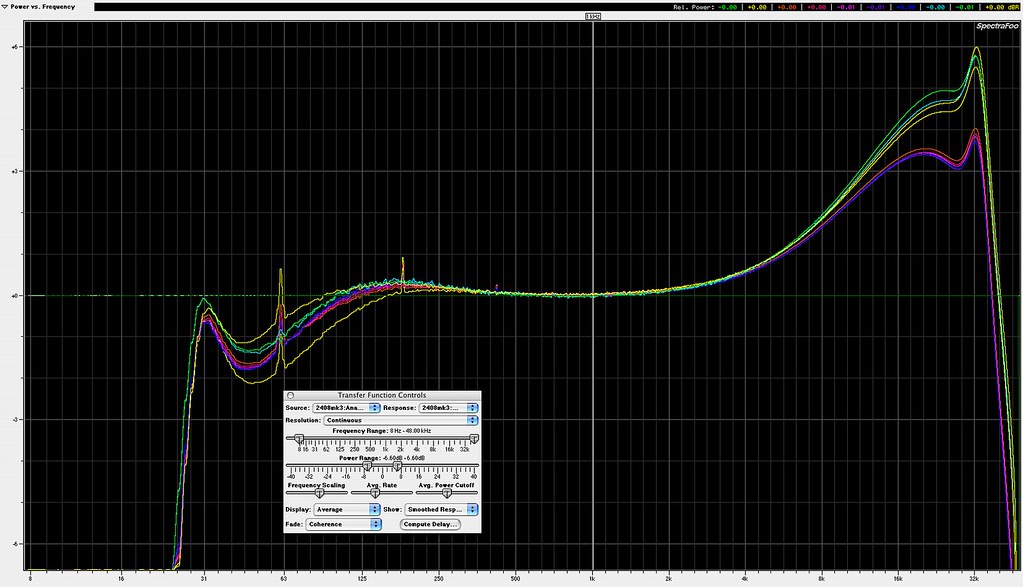
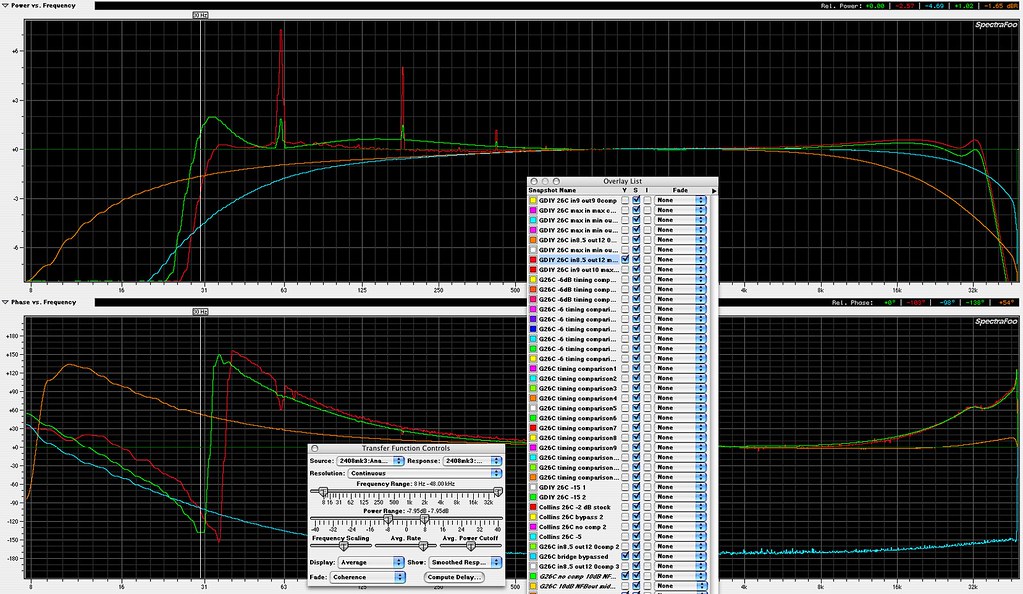
various compression timings, input/output unchanged, varying amounts of GR. This shows relative level change per setting.
Click this link for the full size plots
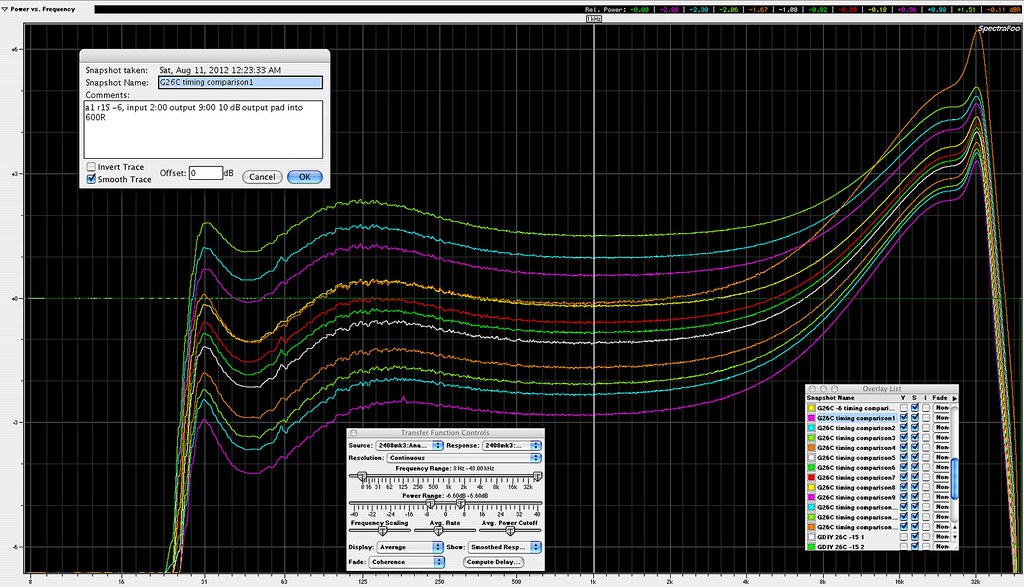
same again, 1K aligned
Click this link for the full size plots
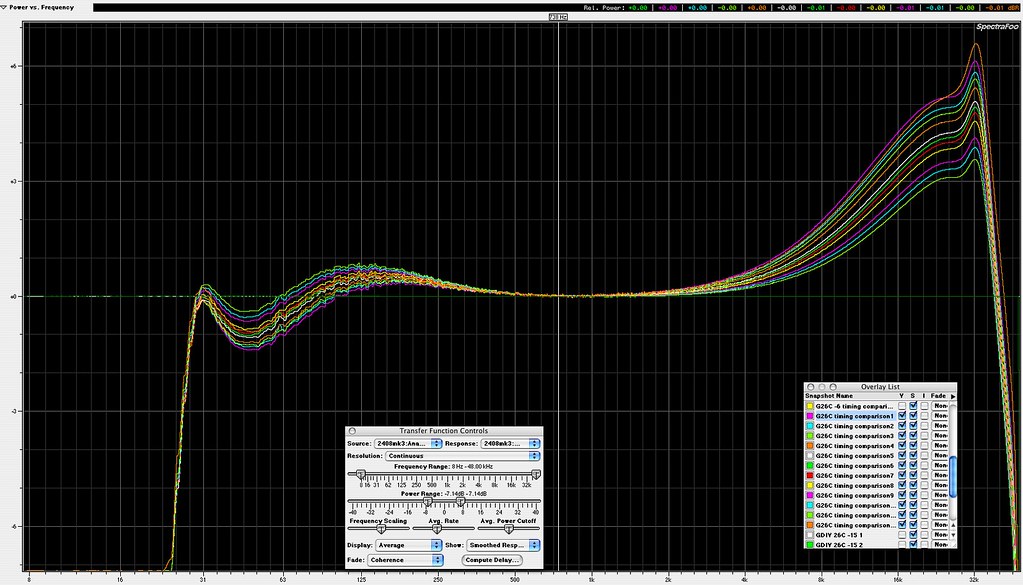
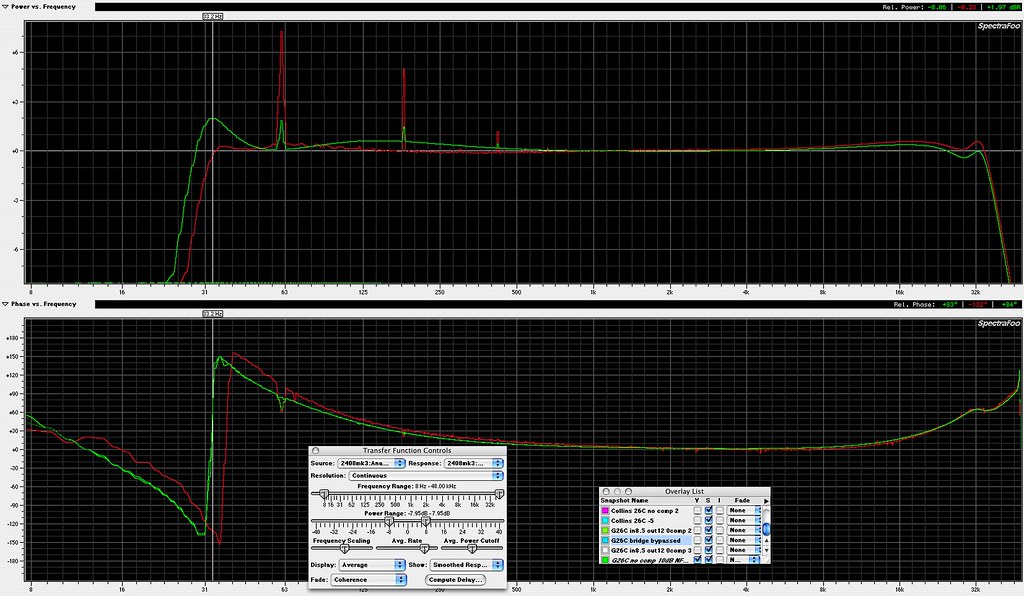
various no compression in/out settings, illustrating response changes due to in/out knob position. This shows increasing hum with increasing output amp gain.
Click this link for the full size plots
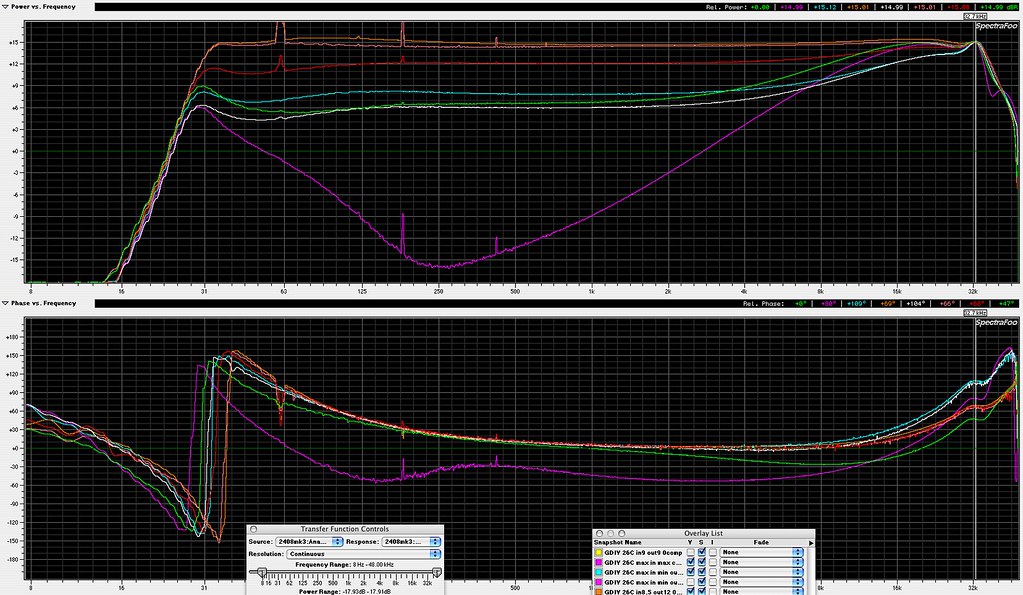
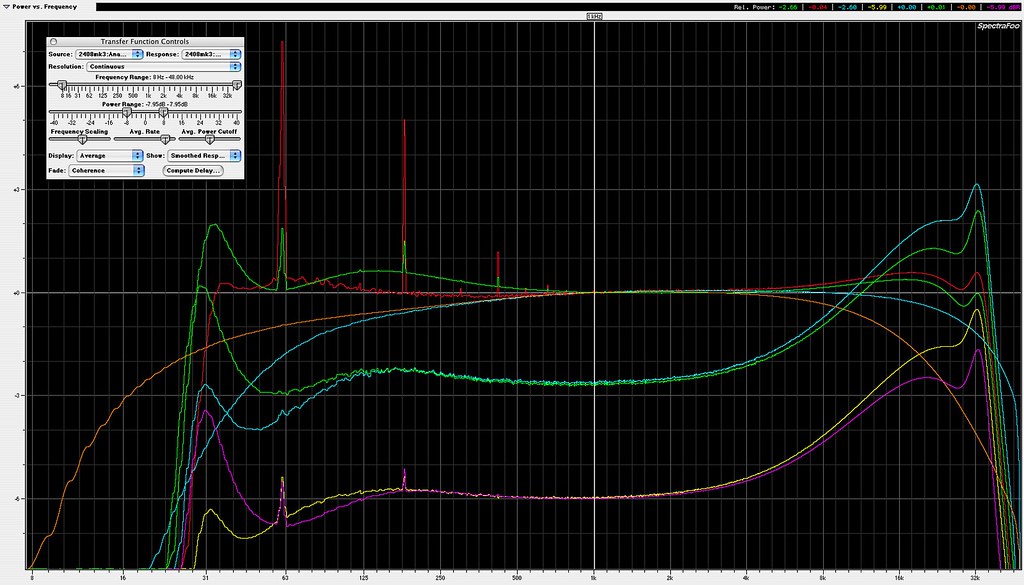
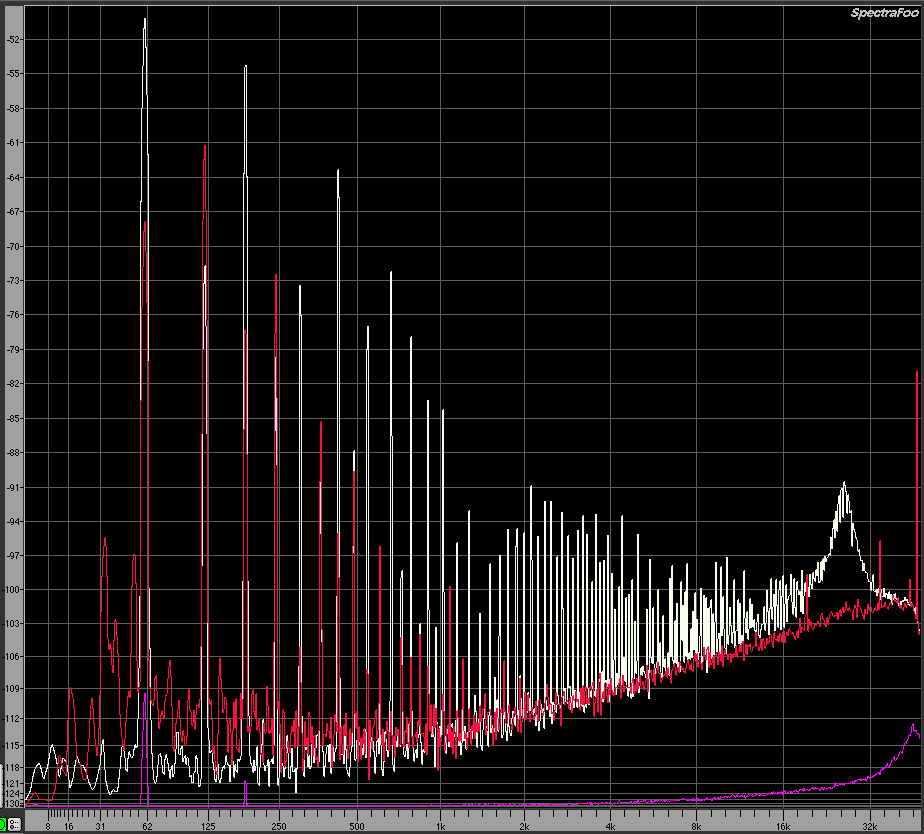
This one may be misleading, various amounts of GR, 32K resonance aligned. Note the purple plot shows the extreme frequency changes that occur once you push GR past prescribed limits, that plot representing between 20-30 dB GR.
Click this link for the full size plots
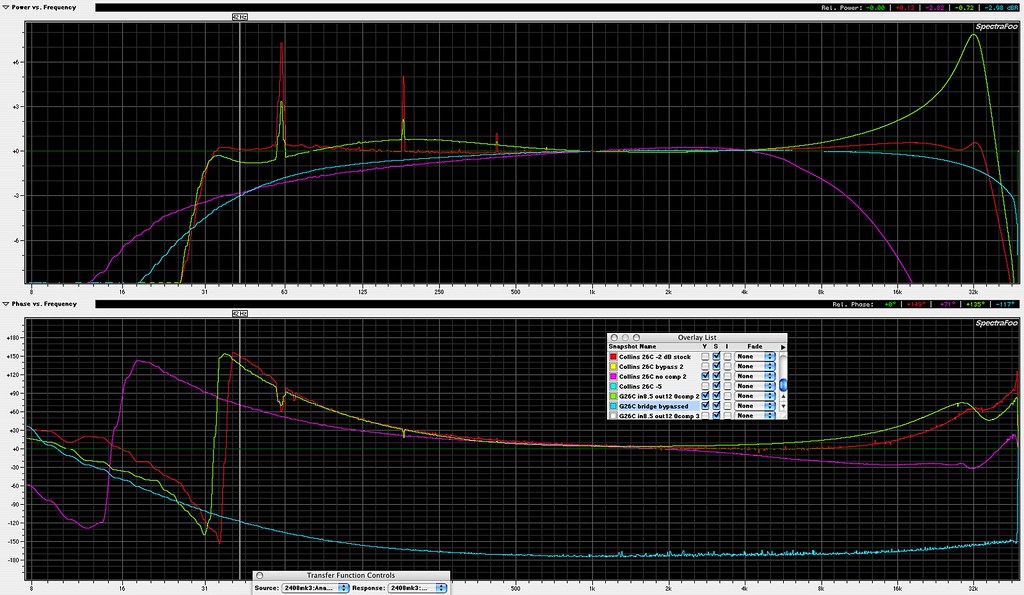
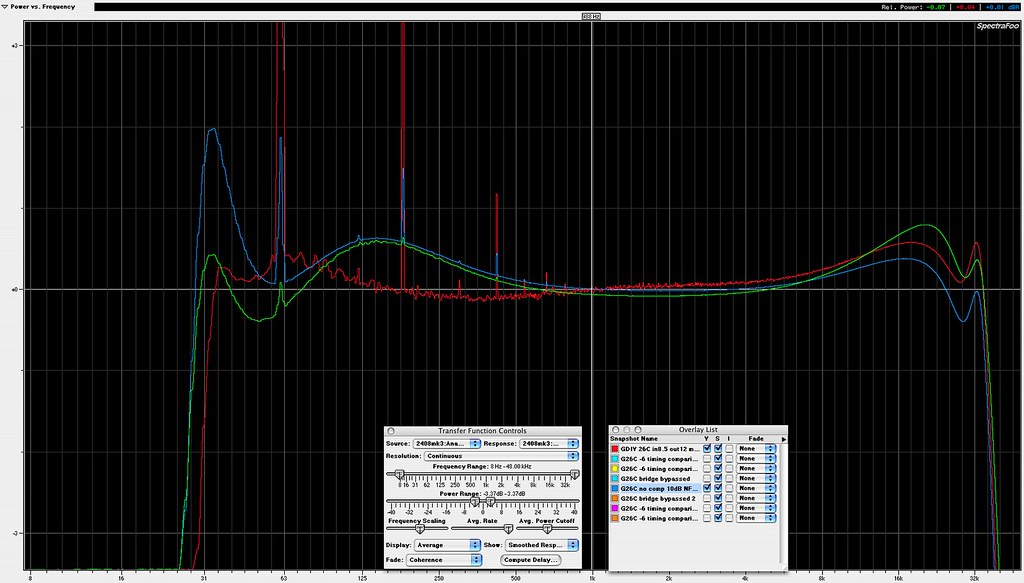
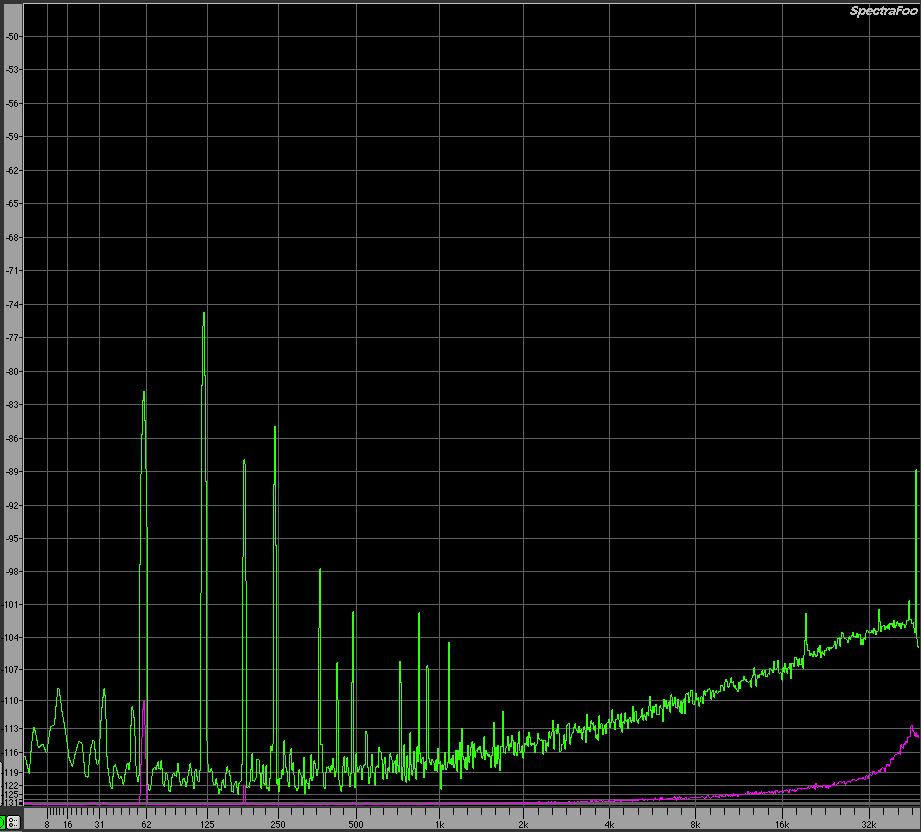
flat (red), 32kHz trap partially bypassed (green), basic amp with bridge partially bypassed (blue), original Collins (purple). Note the blue plot is out of phase in the test.
Click this link for the full size plots
You'll see we have a treble boost under compression, the Collins does not change with compression setting. At this point I suspect the boost is in the interstage transformers, due to the way they react under source, load, and GR conditions.
various compression timings, all set for -6 GR. This shows relative level change per setting.
Click this link for the full size plots
same again, 1K aligned
Click this link for the full size plots
various compression timings, input/output unchanged, varying amounts of GR. This shows relative level change per setting.
Click this link for the full size plots
same again, 1K aligned
Click this link for the full size plots
various no compression in/out settings, illustrating response changes due to in/out knob position. This shows increasing hum with increasing output amp gain.
Click this link for the full size plots
This one may be misleading, various amounts of GR, 32K resonance aligned. Note the purple plot shows the extreme frequency changes that occur once you push GR past prescribed limits, that plot representing between 20-30 dB GR.
Click this link for the full size plots
flat (red), 32kHz trap partially bypassed (green), basic amp with bridge partially bypassed (blue), original Collins (purple). Note the blue plot is out of phase in the test.
Click this link for the full size plots


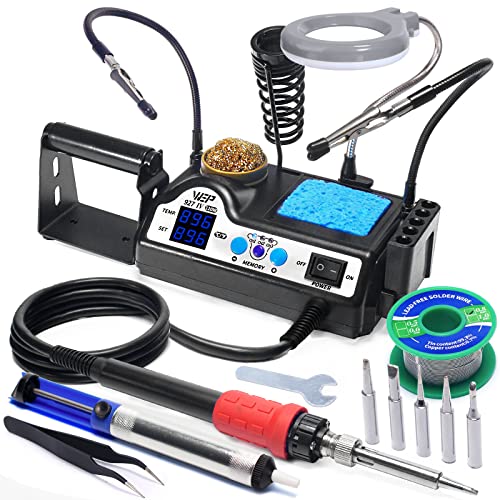


![Soldering Iron Kit, 120W LED Digital Advanced Solder Iron Soldering Gun kit, 110V Welding Tools, Smart Temperature Control [356℉-932℉], Extra 5pcs Tips, Auto Sleep, Temp Calibration, Orange](https://m.media-amazon.com/images/I/51sFKu9SdeL._SL500_.jpg)


")