You are using an out of date browser. It may not display this or other websites correctly.
You should upgrade or use an alternative browser.
You should upgrade or use an alternative browser.
Another diode bridge compressor
- Thread starter Heikki
- Start date


Help Support GroupDIY Audio Forum:
This site may earn a commission from merchant affiliate
links, including eBay, Amazon, and others.


[Just an aside]Thanks for the pointer. Found several U273 with different suffixes and configs. In the attached config it halves the number of diodes needed and thus mismatches, but I'd assume diodes have come a long way since back then.[/aside]That's a suggestion I made a couple of posts ago, however I don't think it's that useful in practice. Note that it's what the Siemens U273 does, albeit with a different bridge arrangement.
Attachments

Hi Script there s a post on u273 with a link with a lot of siemens and tabfunken schematics... I saw 3 version about u273[Just an aside]Thanks for the pointer. Found several U273 with different suffixes and configs. In the attached config it halves the number of diodes needed and thus mismatches, but I'd assume diodes have come a long way since back then.[/aside]
Yes. This one is not really a bridge; it's a single string with two diodes in each direction.Fig 10
THD is not very good.


super! geat jobAlmost ready now. All I’m missing now is the front panel. I ordered one from Schaeffer and it should arrive next week.
i like the SC boards very much
best
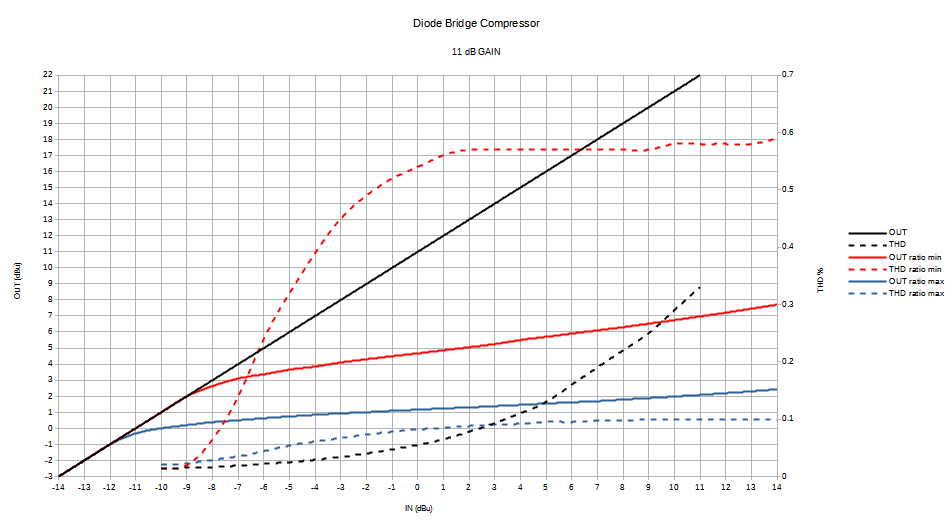
Is this with the 4 diode bridge?Did some measurements today. At max position ratio gets to about 15:1 and at min position it is about 4:1. Distortion is mostly 3rd harmonic. Measurement made at 1kHz with threshold at min position.
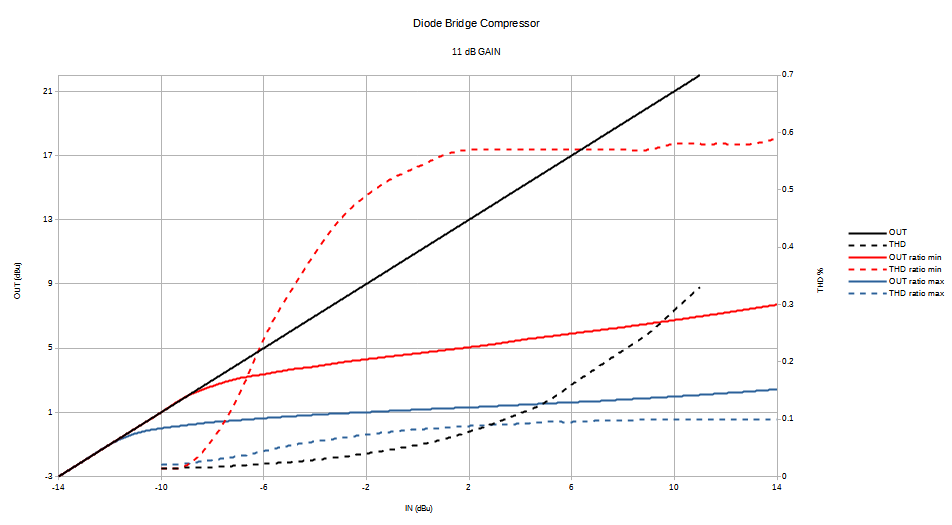
I used REW for measuring and put the data to a spreadsheet.Which software are you using?
Yes it’s a 4 diode bridge.Is this with the 4 diode bridge?
I also made some noise measurements to compare this with my vari mu compressor. The diode bridge compressor is approximately 17 dB noisier than my vari mu. Even though the diode bridge noise is less than spectacular I doubt I will ever get into a situation where I would hear the noise. The noise spec is still a couple dB better than the AMS Neve diode bridge compressor has.
Last edited:
i tried to import my Rew data in libreoffice....measured thd and exported:
min Thr , min Ratio, slow att and fast Rel
but what came out in the chart is something similar to a slew rate response ....
any suggestions please?
min Thr , min Ratio, slow att and fast Rel
but what came out in the chart is something similar to a slew rate response ....
any suggestions please?
Bo Deadly
Well-known member
Just create a chart in Excel (or libreoffice). It's just a line chart. Run signal through the device and monitor the input level vs the output level. Increase signal level incrementally and record the input level in one column and the output level in an adjacent column. Do 10 measurements or so. Then just select that data and insert a line chart. Choose a line format that adds a little smoothing. You can speed up the process a little by creating a wav file in wavepad that plays bursts of noise or tones for at increasing levels for 10 seconds each. Then just play the wav and sit there typing in the levels.
I did the same thing for my "OptoGyro" compressor.
I did the same thing for my "OptoGyro" compressor.
Perfect I ll try...Just create a chart in Excel (or libreoffice). It's just a line chart. Run signal through the device and monitor the input level vs the output level. Increase signal level incrementally and record the input level in one column and the output level in an adjacent column. Do 10 measurements or so. Then just select that data and insert a line chart. Choose a line format that adds a little smoothing. You can speed up the process a little by creating a wav file in wavepad that plays bursts of noise or tones for at increasing levels for 10 seconds each. Then just play the wav and sit there typing in the levels.
I did the same thing for my "OptoGyro" compressor.
Thank you so much
Here’s the libreoffice spreadsheet I made.Which spreadsheet? You did on your own or is possible to find online?
http://ghr.fi/proaudio/diodecomp/diodi.ods


Similar threads
- Replies
- 21
- Views
- 3K
- Replies
- 4
- Views
- 2K